
|
Figure 8
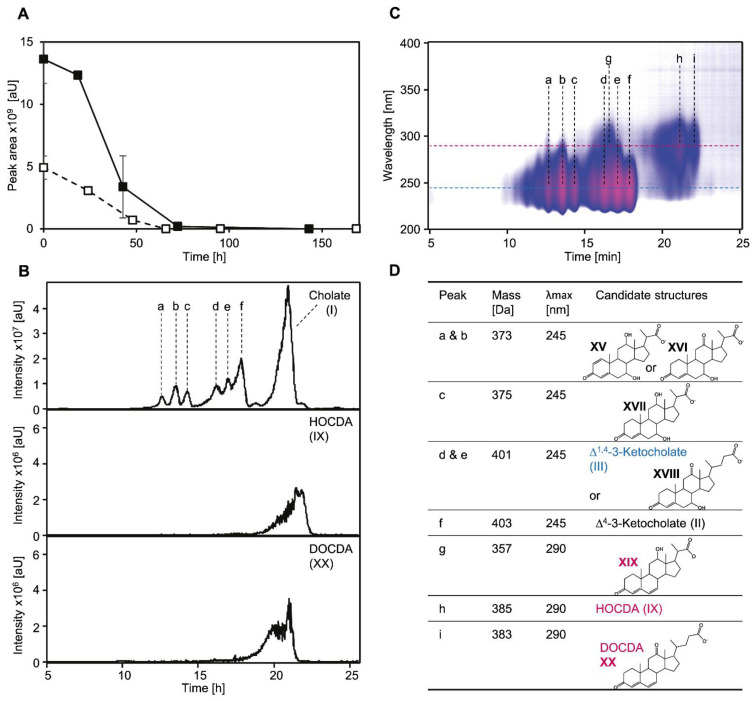
(A) Degradation of 1 mM cholate (solid line, filled squares) and 1 mM HOCDA (IX in Figure 1, dotted line, open squares) in soil slurry microcosms with soil samples from agriculturally used fields in the Münsterland region. Error bars indicate standard deviation (n = 3). (B) MS base peak chromatogram of the extracted supernatant of a soil slurry incubated with 1 mM cholate for about 48 h (top) as well as extracted ion chromatograms with the m/z values of HOCDA (383 Da for [M-H]−1, middle) and DOCDA (XX, 385 Da for [M-H]−1, bottom). Samples were measured in negative MS mode. (C) 3D UV chromatogram of the extracted supernatant of a soil slurry incubated with 1 mM cholate for about 48 h and structure suggestions for several intermediates assigned to peaks. Intensity is shown as a heat map. Red indicates highest absorption. (D) Candidate structures for peaks a-i found in (B,C). Masses and absorption maxima (λmax) were determined by HPLC-MS measurements. Structure suggestions are based on molecular masses, absorption spectra, and retention time. Candidate structures belonging (blue) to the Δ1,4-pathway, (red) to the Δ4,6-pathway, and (black) potentially occurring in both pathways. When structures could not be assigned unambiguously, two possible structures are depicted. XV: 7,12-Dihydroxy-3-oxo-pregna-4-ene-carboxylate, XVI: 7-Hydroxy-3,12-dioxo-pregna-4-ene-carboxylate, XVII: 7,12-Dihydroxy-3-oxo-pregna-4-ene-carboxylate, XVIII: ∆4-3,12-Diketocholate, XIX: DOCDA (12-Hydroxy-3-oxo-pregna-4,6-diene-carboxylate, XX: 3,12-Dioxo-4,6-choldienoate).