
Image
|
Figure Caption
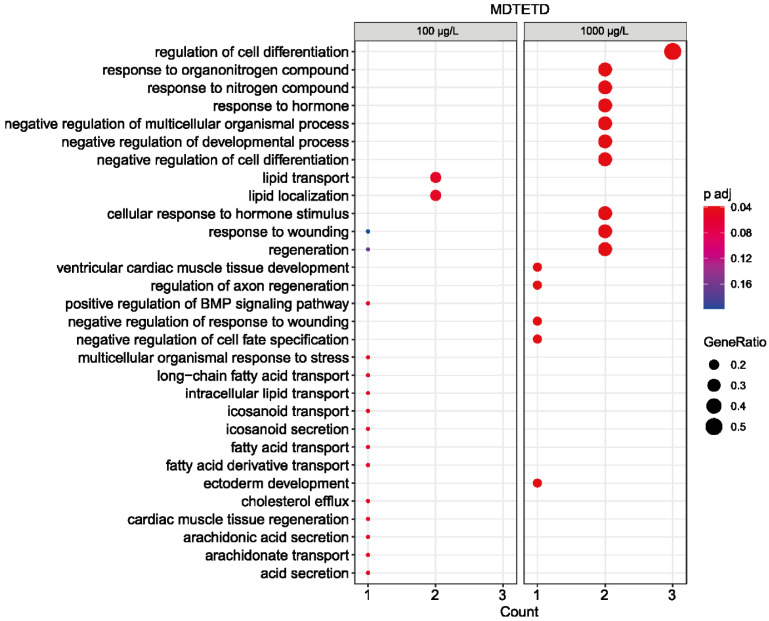
Figure 7
Overrepresentation analysis of GO biological processes based on statistically differentially expressed genes (padj ≤ 0.05) in zebrafish embryos after exposure to nominal concentrations of 100 µg/L (left panel) and 1000 µg/L MDTETD (right panel). The adjusted p-value is indicated as a color code, and the ratio of differentially expressed genes in each condition to the total number of genes assigned to each biological process is indicated by the dot size. The number of statistically differentially expressed genes assigned to each biological process for each condition is shown below.
Acknowledgments
This image is the copyrighted work of the attributed author or publisher, and
ZFIN has permission only to display this image to its users.
Additional permissions should be obtained from the applicable author or publisher of the image.
Full text @ Microorganisms