
Image
|
Figure Caption
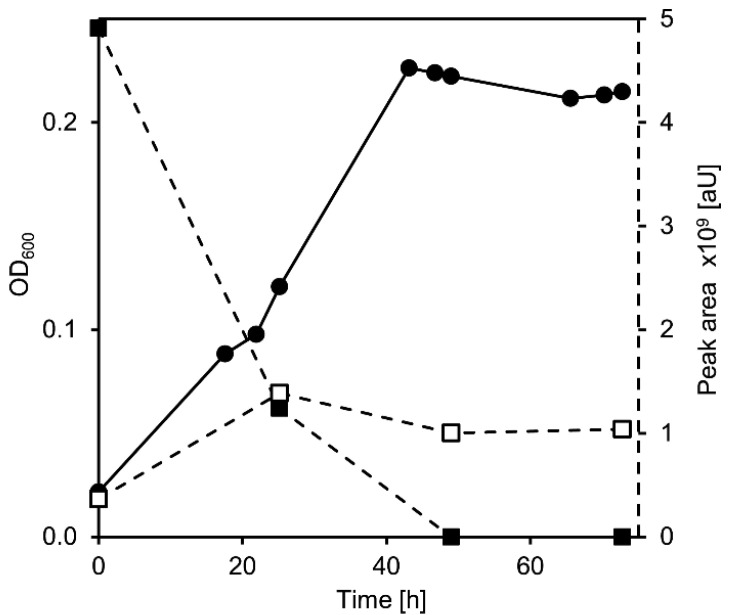
Figure 5
Growth of Sphingobium sp. strain Chol11 with DHSATD (XI in Figure 1, filled circles), degradation of DHSATD (filled squares, second axis), and accumulation of MDTETD (XIII, open squares, second axis) during growth with DHSATD. Error bars indicate standard deviation, which may not be visible if too small (n = 3).
Acknowledgments
This image is the copyrighted work of the attributed author or publisher, and
ZFIN has permission only to display this image to its users.
Additional permissions should be obtained from the applicable author or publisher of the image.
Full text @ Microorganisms