
|
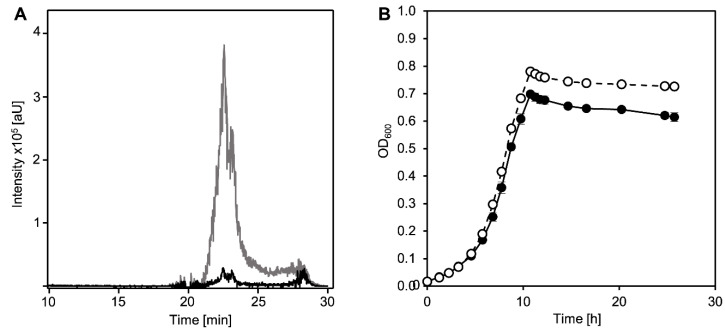
Figure 2
(A) Detection of DHSATD (XI) in supernatants of cultures of Sphingobium sp. strain Chol11 wt (black line) and the deletion mutant Sphingobium sp. strain Chol11 Δnov2c349 (gray line) during growth with cholate after 5.7 h of incubation. HPLC-MS data are displayed as extracted ion chromatogram at negative ion mode of MS (m/z value of DHSATD ([M-H]−1 = 313 Da)).(B) Growth of Sphingobium sp. strain Chol11 wt (filled circles) and Sphingobium sp. strain Chol11 Δnov2c349 (open circles) with 1 mM cholate (I in Figure 1) as sole carbon source. Error bars indicate standard deviation, which may not be visible if too small (n = 3).