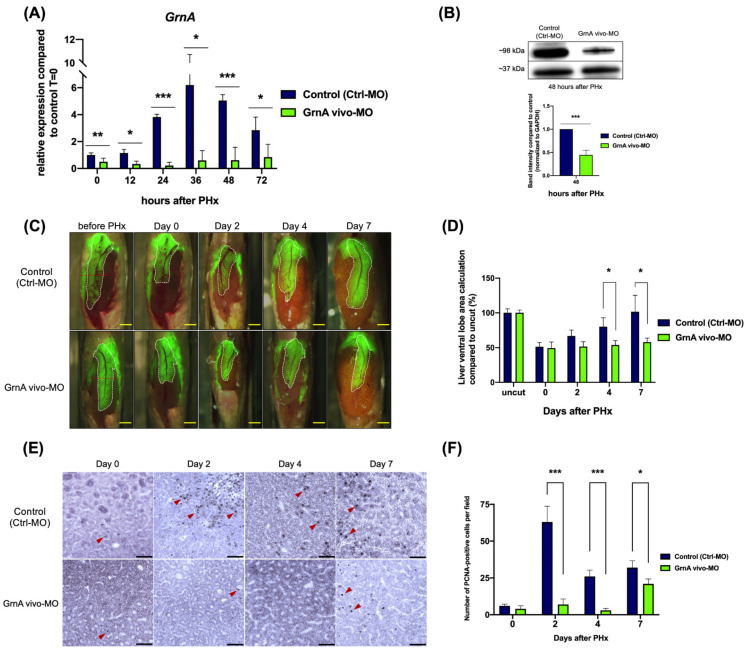
Figure 2
GrnA morphant exhibited impaired liver regeneration after PHx. (A) GrnA gene expression was examined by quantitative PCR after PHx. The relative expression levels are presented as mean ± SD, compared to control group at 0 h PHx. (B) Protein levels of GrnA and GAPDH were examined by Western blot analysis at 2 days after PHx. GrnA protein levels were normalized to GAPDH and then fold-change was calculated compared to control group. The values are presented as mean ± SD. (C) Partial hepatectomy in control (upper) and GrnA morphant (lower) was carried out on day 0. The regenerating liver ventral lobe is shown at 2, 4, and 7 days after PHx. White dotted line indicates liver ventral lobe. Red dotted line shows the site of PHx. Scale bar: 1 mm. (D) Liver ventral lobe area after PHx is shown in (C). The area was normalized to control uncut group and presented as percentage; mean ± SD. (E) Immunohistochemical staining of PCNA in liver ventral lobe at 0, 2, 4, and 7 days after PHx. Red arrowhead indicates the PCNA-positive cells. Scale bar: 50 μm. (F) Number of PCNA-positive cells was quantified after PHx, as shown in (E). The data are presented as mean ± SD. Significance was set at * p < 0.05, ** p < 0.01, *** p < 0.001, as determined by t-test; PHx, partial hepatectomy.

