
|
Figure 4
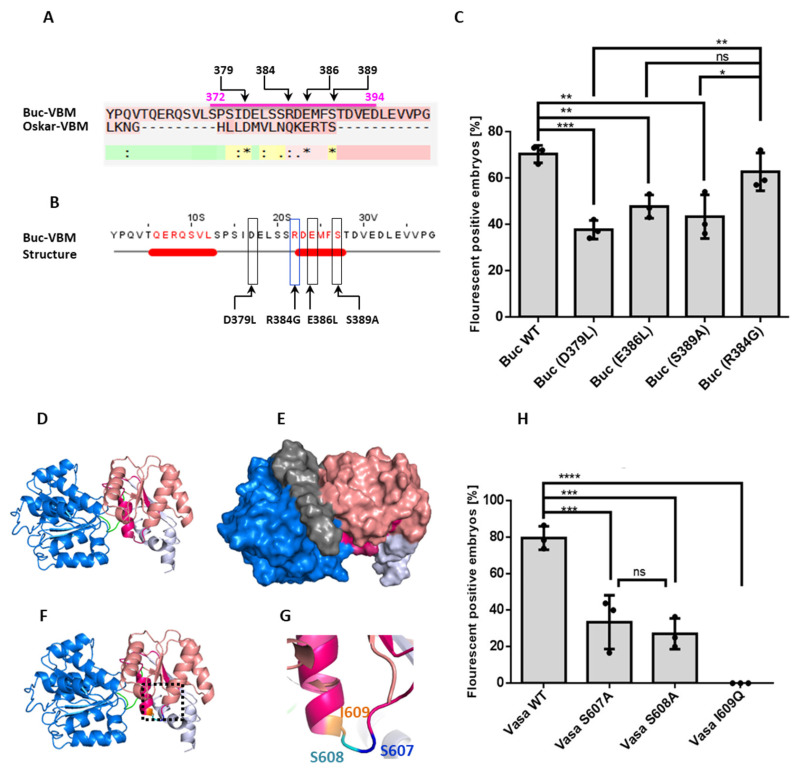
Isolation of the amino acid residues responsible for Buc and zfVasa interactions. (A) Alignment of the Buc-VBM with the Oskar eLOTUS domain. An asterisk (*) denotes the positions with a fully conserved residue. A colon (:) denotes conservation based on strongly similar properties—scoring > 0.5 in the PAM 250 matrix. A dot (.) denotes conservation based on weakly similar properties—scoring ≤ 0.5 in the PAM 250 matrix. An alignment of Buc-VBM and the eLOTUS domain revealed that D379, E384, and S386 are conserved between two sequences (black stars and positions of the amino acids are labeled on top of the sequence). (B) Representation of the three amino acids D379, E386, and S389 in JPred secondary structure prediction (black boxes) and amino acid R384 (blue box) used as a non-conserved control. (C) Quantification of mutant Buc construct interactions with zfVasa. The Y-axis represents the average fluorescent positive embryos. The X-axis represents the injected mutant Buc constructs. All the mutants, Buc D379L (36 ± 5.1%, n = 86), E386L (48 ± 9.4%, n = 77), and S389A (43 ± 3.4%, n = 50), showed a reduction of fluorescent embryos compared to wild-type Buc (70 ± 4.6%, n= 69) or in the control R384G (63 ± 8.2%, n = 63). In particular, the D379L mutant variant showed the weakest activity when compared to the Buc wild-type and control R384G. (D) Homology model predicted for zfVasa with the RecA-like N-terminal domain (blue) and RecA-like C-terminal domain (salmon). zfVasa-BBM is colored in magenta. (E) Surface representation of the predicted model showing the exposed region of zfVasa-BBM (magenta). (F) Model highlighting the exposed three amino acids (inset in the black dashed line) in the rainbow colors described in (D). (G) Magnification of the exposed amino acids S607 (blue), S608 (green), and I609 (orange). (H) Quantification of the mutant zfVasa construct interactions with Buc. The Y-axis represents fluorescent embryos from three independent experiments. The X-axis represents the injected mutant zfVasa constructs. zfVasa S607A (38 ± 14.0, n =61) and zfVasa S608A (27 ± 8.0, n = 33) showed a reduced number of fluorescence-positive embryos, whereas zfVasa I609Q completely lost the interaction (0 ± 0, n = 61) compared to the wild-type zfVasa (79 ± 6.4, n = 64). Moreover, there was no significant statistical difference observed between zfVasa S607A and S608A. Test statistics: Student’s t-test, * = 0.05, ** = 0.01, *** = 0.001, and **** = 0.0001. ns = not significant.