
|
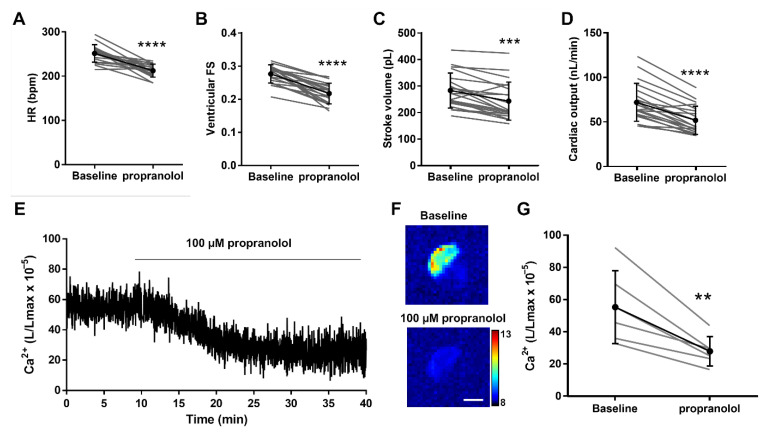
Figure 6 Effect of the β-adrenergic antagonist propranolol on hemodynamic parameters and ventricular Ca2+ levels in 4 dpf Tg(myl7:GA) zebrafish larvae. Heart rate (HR) (A), ventricular fractional shortening (FS) measured with the major diameter (B), stroke volume (C), and cardiac output (D) before (baseline) and after 30 min incubation with 100 µM propranolol. Data are shown as mean ± SD (n = 20). (E) Representative experiment of the effect of 100 µM propranolol on ventricular Ca2+ levels (L/Lmax) (1 Hz image acquisition frequency). (F) The images show the integrated luminescence from baseline (min 0–10) and propranolol (min 30–40) periods of the experiment in (E). The scale bar represents 100 µm and the colour scale indicates RLU. (G) Ca2+ levels (L/Lmax) after 30 min of treatment with 100 µM propranolol. Data are shown as mean ± SD (n = 6). These experiments were performed using diacetyl h-CTZ. Statistical analysis was performed using a two-tailed paired t-test. ** p <0.01, *** p < 0.001 and **** p < 0.0001.