
|
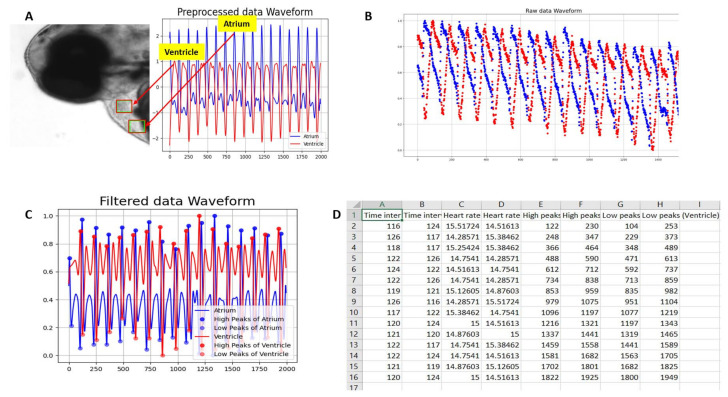
Figure 2 (A) ROI selection for ventricle and atrium in zebrafish heart video. The amplitude on the y-axis and the number of frames on the x-axis against the ROI in the selected video were presented. The division algorithm was to find the peaks based on each frequency of selected frames. (B) Raw heartbeat signals obtained from OpenCV. Blue peaks showing atrium heart rate, and red peaks presented ventricle heart rate. The X-axis contains the number of frames, and the y-axis shown amplitude based on pixels intensity. Overlay graph having atrium and ventricle beat per minute results. (C) The filtered heartbeat waveforms for both the atrium (blue color) and ventricle (red color). (D) Output data format in excel showing some important measurements.