
|
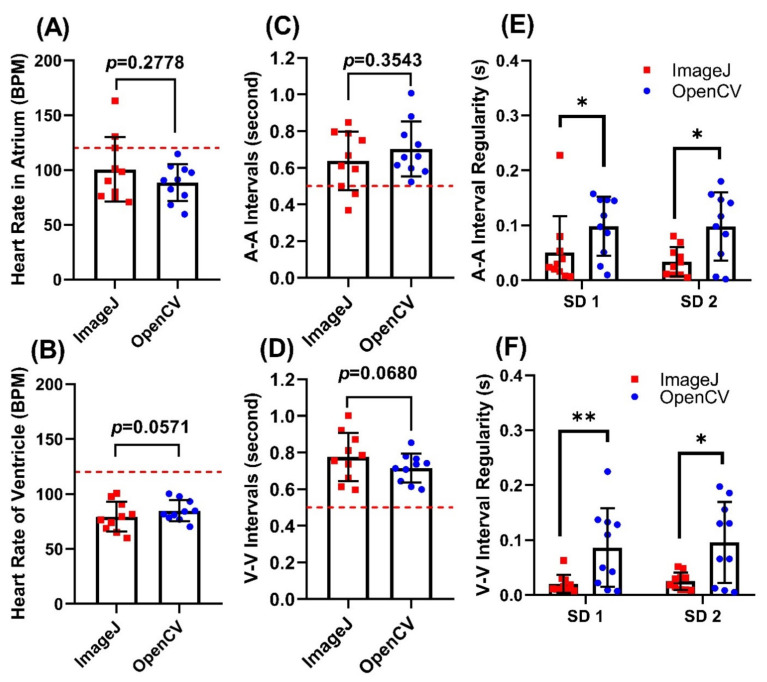
Figure 6 Comparison of heart rate and cardiac rhythm measurement in 500 ppm Camphor-treated zebrafish embryos aged at 72 hpf using either OpenCV or ImageJ methods. Comparison of heart rate obtained from either atrium (A) or ventricle (B) chambers using ImageJ TSA and OpenCV methods. Comparison of atrium to atrium (A-A) (C) and ventricle to ventricle (V-V) (D) intervals using ImageJ and OpenCV methods. Comparison of heartbeat regularity in either atrium (E) or ventricle (F) using either ImageJ or OpenCV methods, red dotted line signified normal value of each parameter obtained from control group. Data was calculated using t-test (A,B) and Wilcoxon test (C–F), and presented as Mean ± SD, n = 10 (* p < 0.05; ** p < 0.01).