
|
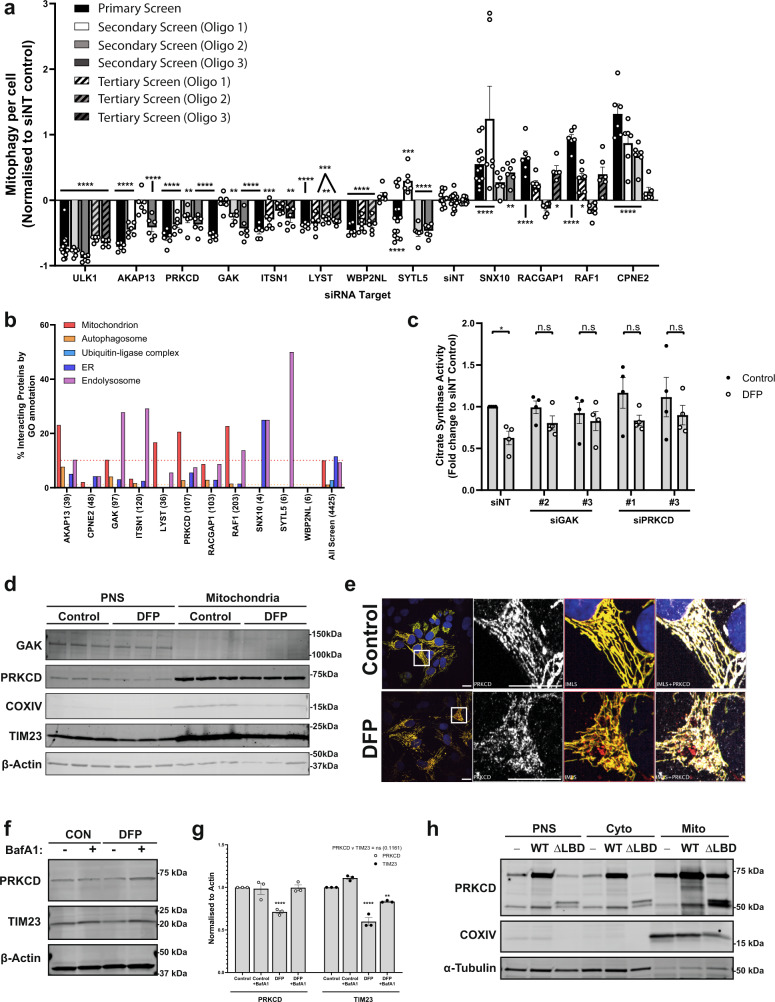
Fig. 3 a Summary of significant targets identified across primary, secondary (7.5 nM individual siRNA oligos) and tertiary screens (15 nM each oligo) siRNA screens. Cells were transfected for 48 h prior to 24 h of 1 mM DFP treatment. Bars represent mean fold change in mitophagy relative to the siNT controls ± SEM from n = 12 (siNT, primary + secondary), n = 13 (SNX10, primary), n = 14 (SYTL5 + ULK1, primary), n = 17 (siNT, secondary) or n = 6 (all others) independent plates. Significance was determined by one-way ANOVA followed by Dunnett’s multiple comparison test to the siNT control. b Protein–protein interaction networks for candidate proteins (see “Methods”) were plotted by % of interacting proteins belonging to each highlighted compartment, value in brackets represents total number of interacting proteins. Dashed lines indicate average values from all screened proteins for mitochondria (red) or autophagosome (orange). c siRNA treatment with indicated oligos for 48 h prior to 24 h treatment ± 1 mM DFP and subsequent analysis of citrate synthase activity levels. Values were normalised to the siNT control and plotted ± SEM for n = 4 independent experiments. Significance was determined by two-way ANOVA followed by Sidak’s multiple comparison test. d U2OS cells treated ± 1 mM DFP for 24 h were enriched from a post-nuclear supernatant (PNS) for mitochondria followed by western blotting for the indicated proteins. e U2OS IMLS cells treated ± 1 mM DFP for 24 h followed by PFA fixation and staining for endogenous PRKCD (Alexa Fluor-647). Scale bar = 20 µm. f U2OS cells treated ± 1 mM DFP for 24 h ± 50 nM BafA1 for the final 16 h and blotted for the indicated proteins. g Quantitation of PRKCD and TIM23 levels to β-actin in (f) from n = 3 independent experiments ± SEM. Significance was determined by two-way ANOVA followed by Dunnett’s multiple comparison test to the control. h U2OS cells (−) or those stably expressing PRKCD wild type (WT) or PRKCD ∆C1 ∆C2 (∆lipid-binding domains—LBD) were enriched from a post-nuclear supernatant (PNS) for cytosol and mitochondrial fractions followed by western blotting for the indicated proteins. Representative from n = 2 experiments *P < 0.05, **P < 0.01, ***P < 0.001, ****P < 0.0001 and n.s. = not significant in all relevant panels. For precise P values, see the source data file.