
Fig. 1
- ID
- ZDB-IMAGE-211025-26
- Publication
- Silva et al., 2021 - In situ and transcriptomic identification of microglia in synapse-rich regions of the developing zebrafish brain
- All Figures
- Figures for Silva et al., 2021
|
Fig. 1
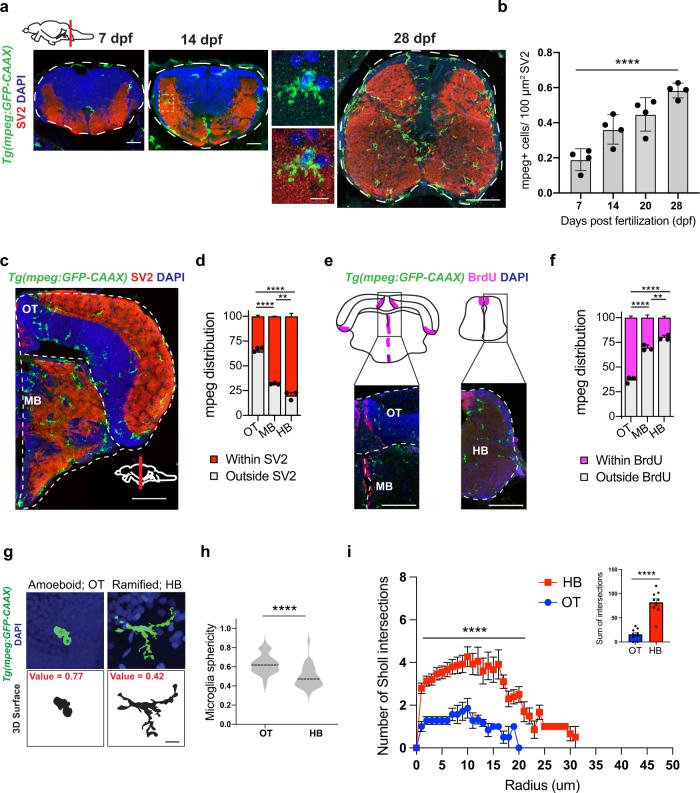
a Representative images of microglia (mpeg1.1-GFP+) and synapses (SV2 antibody stain) in developing zebrafish hindbrain. Inset: representative synapse-embedded microglia at 14 dpf. Scales: 7–14 dpf, 20 µm; 28 dpf, 50 µm; inset, 5 µm. All images are representative of the n = 4 replicates. b Quantification of mpeg1.1-GFP+ cells per 100 μm2 of SV2+ synaptic area at 7, 14, and 28 days post fertilization. Dots represent four individual fish, data are mean ± SD. One-way ANOVA *p < 0.0001. c–d Representative images and quantification of the proportion of mpeg1.1-GFP+ cells in synaptic (SV2+; red) vs. cellular (DAPI+/SV2−; gray) areas. Distribution quantified within each brain region as outlined (dotted lines): midbrain (MB), optic tectum (OT), and hindbrain (HB, see panel 1 A). Mean ±SEM from n = 3 fish. Two-way ANOVA with Tukey’s post hoc comparison; ****p < 0.0001, **p < 0.0029. Scale: 50 µm. e–f Representative images and quantification of the proportion of mpeg1.1-GFP+ cells within 20 µm of BrdU+ neurogenic regions (purple) vs. outside neurogenic regions (gray). Mean ±SEM from n = 3 fish. Two-way ANOVA with Tukey’s post hoc comparison; ****p < 0.0001, **p < 0.0062. Scale: 50 µm. g Representative images of mpeg1.1-GFP+ microglia and thresholded maximal projections in OT and HB at 28 dpf. Value = sphericity; scale 0–1, 1 = most spherical/ameboid. 5 µm. Images are representative of respective values indicated in red. h Quantification of microglial sphericity from images thresholded as in g. n = 50 microglia per region from n = 4 fish. The dotted line indicates the median. two-tailed unpaired t test; ****p < 0.0001 I Sholl analysis quantifying the number of intersections (y axis) measured at 1 µm increments from the soma (x axis) in microglia from optic tectum (OT) and hindbrain (HB). Total of n = 9 microglia per region from n = 3 fish. Mean ±SEM. Two-way ANOVA with Sidak’s multiple comparisons; ****p < 0.0001. Inset: two-tailed unpaired t test; ****p < 0.0001. See also Fig. S1.