
Fig. 4
- ID
- ZDB-IMAGE-211025-2
- Publication
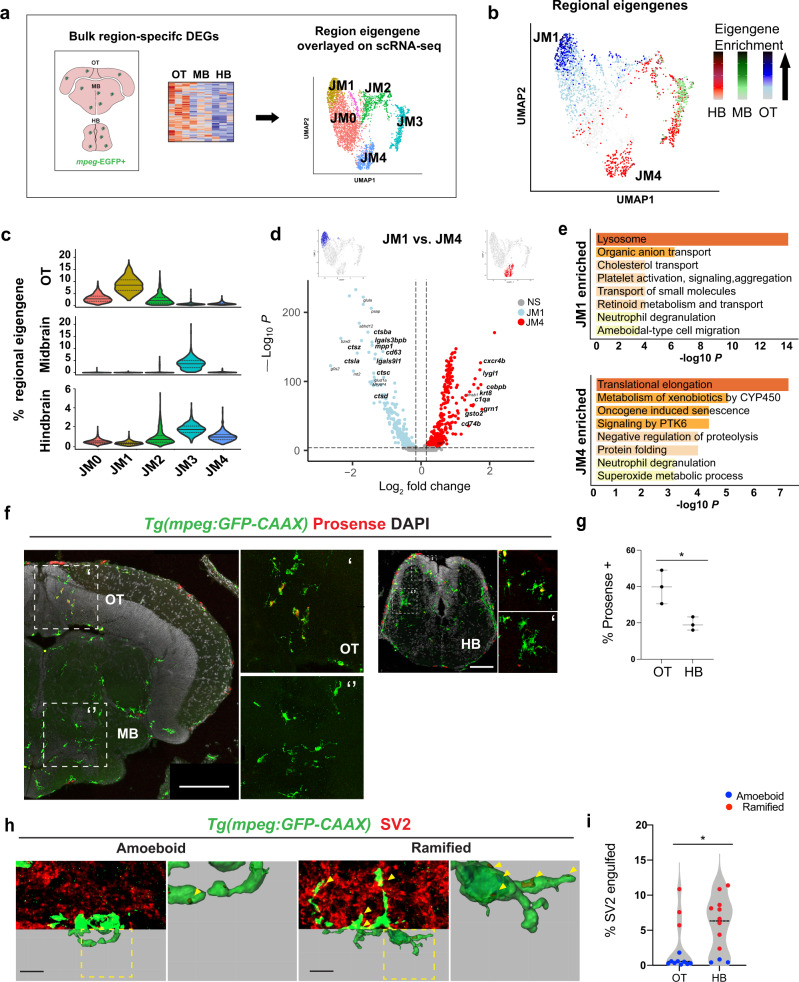
- Silva et al., 2021 - In situ and transcriptomic identification of microglia in synapse-rich regions of the developing zebrafish brain
- All Figures
- Figures for Silva et al., 2021
|
Fig. 4