
|
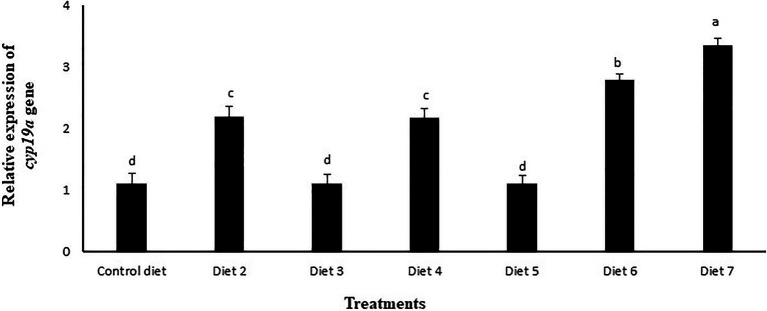
Figure 6 Effects of feeding various experimental diets for 120days on the relative expression of cyp19a gene in the ovary of zebrafish, normalized against β-actin factor as reference gene. Bars with different letters indicate significant differences (p<0.05). Data are presented as mean±SE of three replicates. Diet 1 (control diet), Diet 2 (supplemented with 1% mushroom extract prepared from 50% concentrated extract), Diet 3 (supplemented with La at 107CFUg−1 of diet), Diet 4 (supplemented with Lb at 107CFUg−1 of diet), Diet 5 (supplemented with La at 107CFUg−1 of diet +1% mushroom extract prepared from 50% concentrated extract), Diet 6 (supplemented with Lb at 107CFUg−1 of diet +1% mushroom extract prepared from 50% concentrated extract), and Diet 7(supplemented with La and Lb, each at 107CFUg−1 of diet +1% mushroom extract prepared from 50% concentrated extract).