
Image
|
Figure Caption
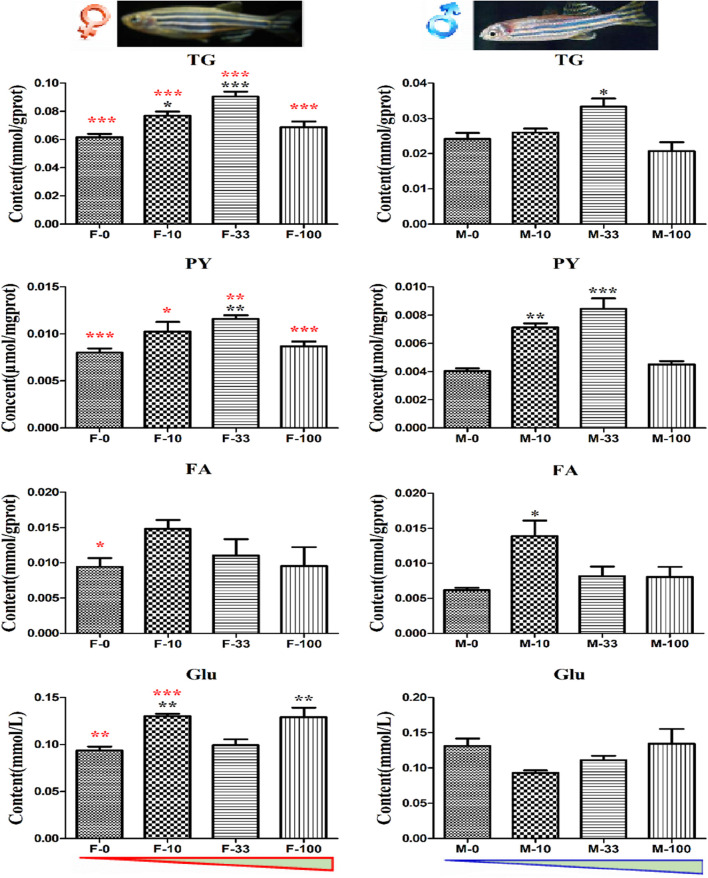
FIGURE 6
The energy metabolites in DEHP exposed zebrafish intestines. The contents of metabolites TG, PY, FA, and Glu related to the energy cycle in treated zebrafish were measured with three biological replicates per group, and the black symbols *, **, and *** implied p < 0.05, 0.01, and 0.001, respectively. Moreover, the contents in both sex zebrafish were different, and the red color symbols *, **, and *** stand for the significant difference between female and male fish in the same groups. The red and blue triangles mean the increasing DEHP exposure concentration in female and male groups.
Acknowledgments
This image is the copyrighted work of the attributed author or publisher, and
ZFIN has permission only to display this image to its users.
Additional permissions should be obtained from the applicable author or publisher of the image.
Full text @ Front Microbiol