
|
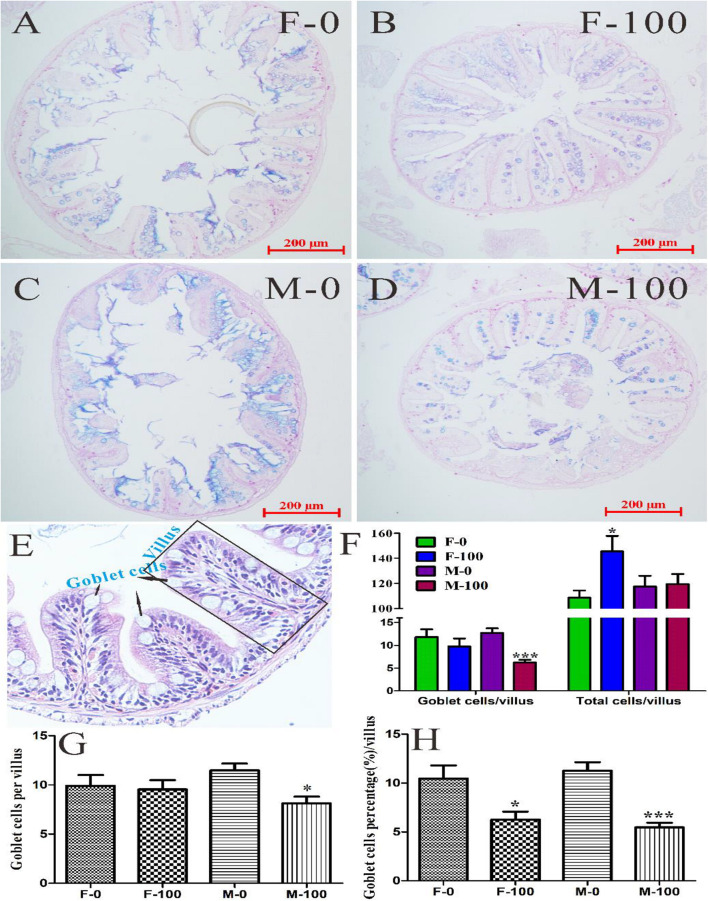
FIGURE 5
The goblet cells in zebrafish intestine tissues with AB-PAS and H&E stain. The histological analysis of gut tissue in female (A) and male (C) zebrafish in the control group, female (B) and male (D) zebrafish in the 100 μg/L DEHP treatment group. From the H&E sections of gut tissues (E), the goblet cells and total cells of each villus (F) were counted. (G) The number of goblet cells was counted from AB-PAS sections with 200 μm scale bar and 200× images, and (H) the percentages of goblet cells per villus were calculated by comparing total cells in the corresponding villus. There was no difference between females and males in the same group, and the symbol * and *** indicated p < 0.05 and 0.001 as the significant changes compared to control.