
|
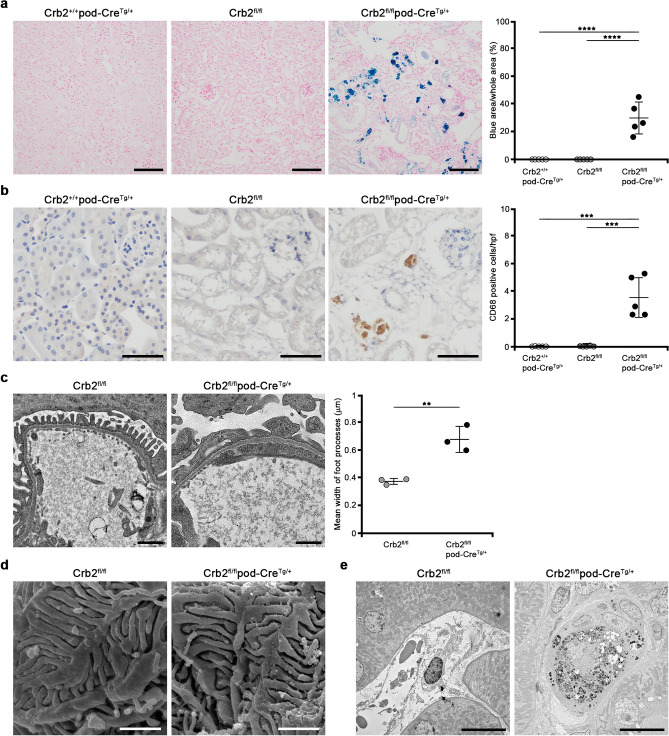
Figure 4
Hemosiderin accumulation and CD68-positive cells in the interstitium of podocyte-specific Crb2 knockout mice at 6 months of age and electron microscopic study. (a) The blue area was significantly larger in Crb2fl/flpod-CreTg/+ mice than in Crb2+/+pod-CreTg/+ or Crb2fl/fl mice. Scale bars 100 μm. (b) The brown cells in the interstitium of Crb2fl/flpod-CreTg/+ mice were positive for CD68, suggesting that they were macrophages. CD68-positive cells were significantly more frequent in the interstitium of Crb2fl/flpod-CreTg/+ mice than in that of Crb2+/+pod-CreTg/+ or Crb2fl/fl mice. HPF high-power field. Scale bars 50 μm. Data are presented as mean ± SD. Statistical analysis by one-way analysis of variance, followed by Scheffe's multiple comparison test; n = 5 in each group. ***P < 0.001, ****P < 0.0001. (c) Transmission electron microscopy showed foot process effacement in Crb2fl/flpod-CreTg/+ mice compared to Crb2fl/fl mice. Scale bars 1 μm. The mean width of the foot processes in Crb2fl/flpod-CreTg/+ mice was significantly greater than that in Crb2fl/fl mice. Data are presented as mean ± SD. Statistical analysis by Student's t-test; n = 3 in each group. **P < 0.01. (d) Scanning electron microscopy showed damage to the foot processes' urinary sides in Crb2fl/flpod-CreTg/+ mice compared to Crb2fl/fl mice. Scale bars 1 μm. (e) Hemosiderin-laden macrophages were observed in the interstitial area of Crb2fl/flpod-CreTg/+ mice, but not in that of Crb2fl/fl mice, at 6 months of age. Scale bars 10 μm.