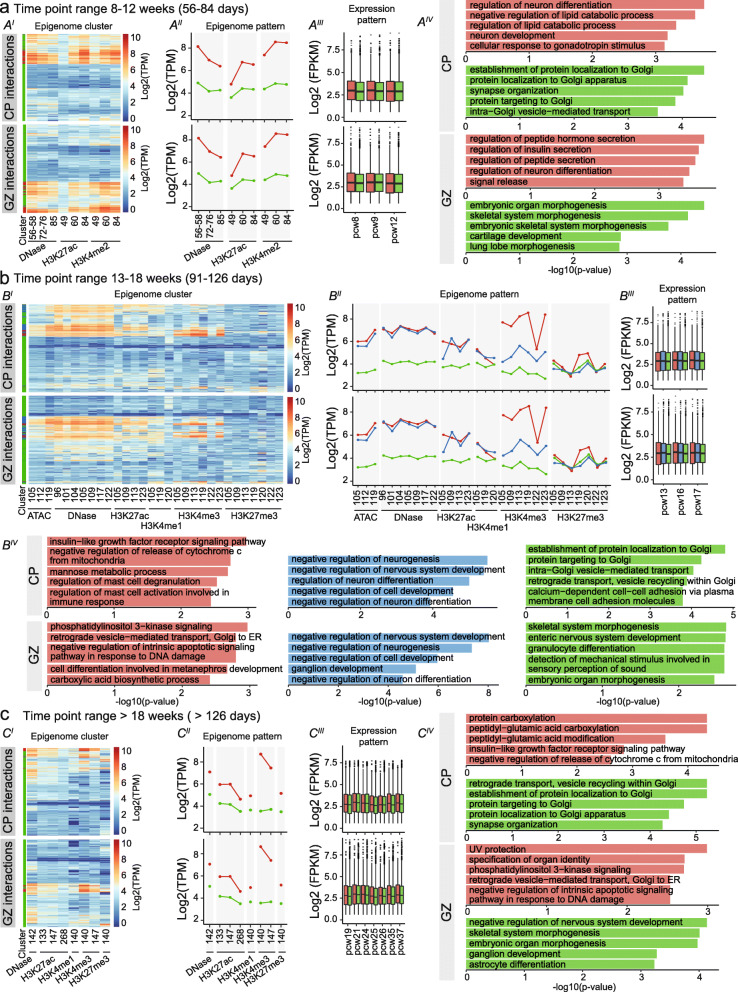
Clustering of DAEs unravels temporal dynamics of brain gene regulation. A Heatmap displaying all available epigenome features for PCW 8-12, across all DAEs interacting with protein-coding genes in CP (upper heatmap) and GZ (lower heatmap) (AI). K-means clustering analysis of epigenome features (AII) identifies two clusters, cluster 1 (red) and cluster 2 (green). Level of enrichment is indicated on the y-axis in Log2 TPM. Box plots (AIII) shows RNA-seq gene expression of protein-coding genes regulated by the DAEs from each cluster (Expression pattern), for available data from PCW 8, 9, and 12 [20]. Boxes are IQR; line is median; and whiskers extend to 1.5 the IQR. Gene enrichment analysis for the corresponding genes in each cluster (AIV). X-axis shows the − log 10 (p value) from Enrichr. B As for A, but now for PCW 13–18. C As for A, but now for PCW > 18
Acknowledgments
This image is the copyrighted work of the attributed author or publisher, and
ZFIN has permission only to display this image to its users.
Additional permissions should be obtained from the applicable author or publisher of the image.
Full text @ Genome Med.
Your Input Welcome
Thank you for submitting comments. Your input has been emailed to ZFIN curators who may contact you if
additional information is required.
Oops. Something went wrong. Please try again later.