IMAGE

Figure 2

ID
ZDB-IMAGE-211018-78
Source
Figures for Zang et al., 2021
Image
Figure Caption

Figure 2

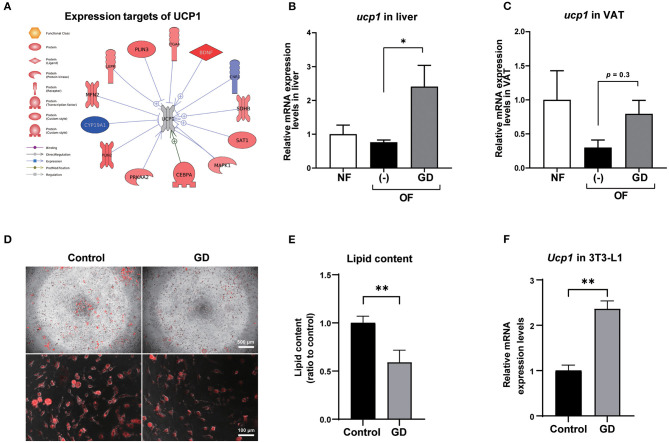
Expression levels of UCP1 in zebrafish liver and VAT. (A) Protein expression targets of UCP1 were identified by Pathway Studio comparing altered genes in GD-treated zebrafish with those of OF zebrafish. The red and blue colors denote genes with increased and decreased expression, respectively. The gray color of UCP1 indicates UCP1 was not detected in RNA-Seq analysis. Gene expression level changes of ucp1 in zebrafish liver (B) and VAT (C) were validated by qPCR analysis. *p < 0.05 vs. OF, n = 5, error bars indicate SD. (D) Representative images of AdipoRed staining of differentiated control adipocytes and GD-treated adipocytes. 3T3-L1 cells were differentiated and treated with 10 mg/mL GD for 2 days and processed for AdipoRed staining. Mature adipocytes were photographed at the magnification of 40 × (upper panels) and 200 × (lower panels). The red color indicates lipid accumulation. (E) Effect of 10 mg/mL GD on intracellular lipid accumulation in 3T3-L1 adipocytes. Cellular lipid content was measured by AdipoRed assay. **p < 0.01 vs. control. (F) GD-induced mRNA expression level change of Ucp1 in 3T3-L1 cells. **p < 0.01 vs. control, n = 6, error bars indicate SD.

Acknowledgments
This image is the copyrighted work of the attributed author or publisher, and ZFIN has permission only to display this image to its users. Additional permissions should be obtained from the applicable author or publisher of the image. Full text @ Front Nutr