
Figure 4
- ID
- ZDB-IMAGE-211014-13
- Publication
- Tao et al., 2021 - CHAF1A Blocks Neuronal Differentiation and Promotes Neuroblastoma Oncogenesis via Metabolic Reprogramming
- All Figures
- Figures for Tao et al., 2021
|
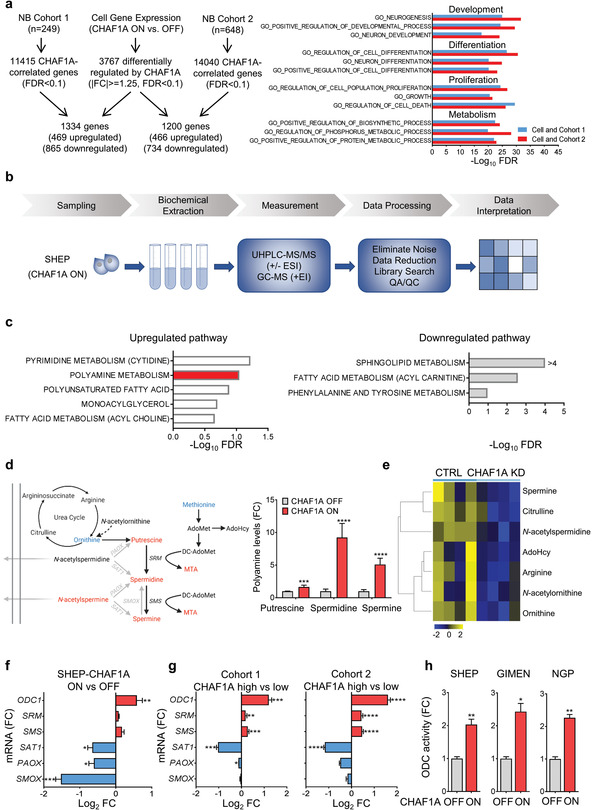
Figure 4
CHAF1A gene expression and pathway analyses of NB cells and patients. a) Left: overlap of differentially expressed genes (DEGs, |(fc)| > = 1.25, FDR < 0.1) between control (CHAF1A OFF) and CHAF1A‐overexpressing SHEP cells (CHAF1A ON, 96 h) and