
Fig. 3.
- ID
- ZDB-IMAGE-211009-54
- Publication
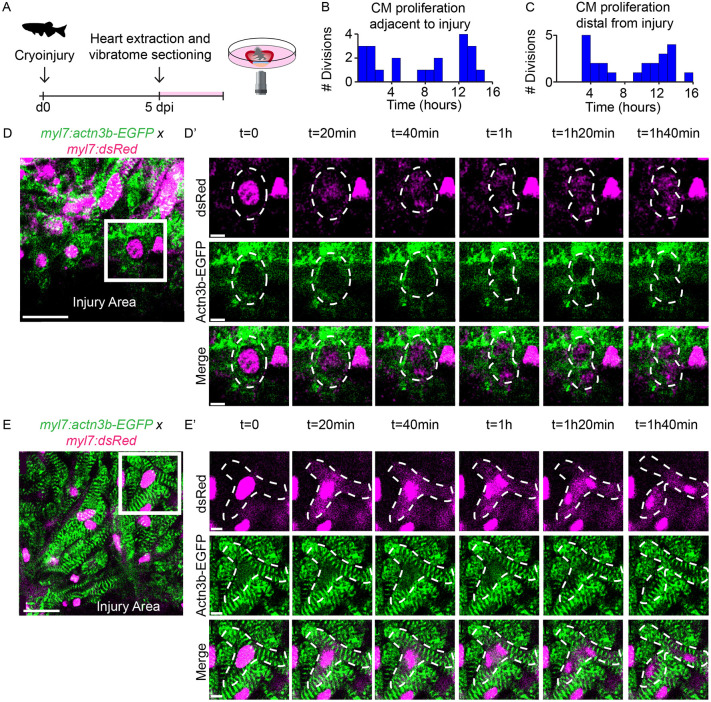
- Honkoop et al., 2021 - Live imaging of adult zebrafish cardiomyocyte proliferation ex vivo
- All Figures
- Figures for Honkoop et al., 2021
|
Fig. 3.