
Fig. 2
- ID
- ZDB-IMAGE-211009-29
- Publication
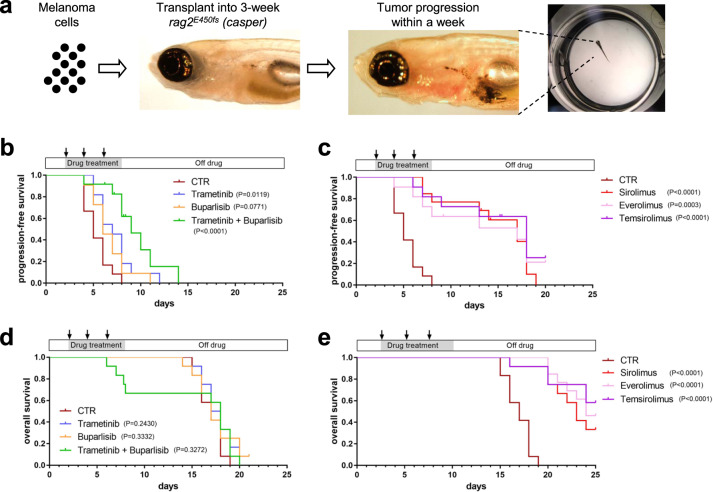
- He et al., 2021 - Synergistic melanoma cell death mediated by inhibition of both MCL1 and BCL2 in high-risk tumors driven by NF1/PTEN loss
- All Figures
- Figures for He et al., 2021
|
Fig. 2