
Figure 4
- ID
- ZDB-IMAGE-211009-22
- Publication
- Pancholi et al., 2021 - RNA polymerase II clusters form in line with surface condensation on regulatory chromatin
- All Figures
- Figures for Pancholi et al., 2021
|
Figure 4
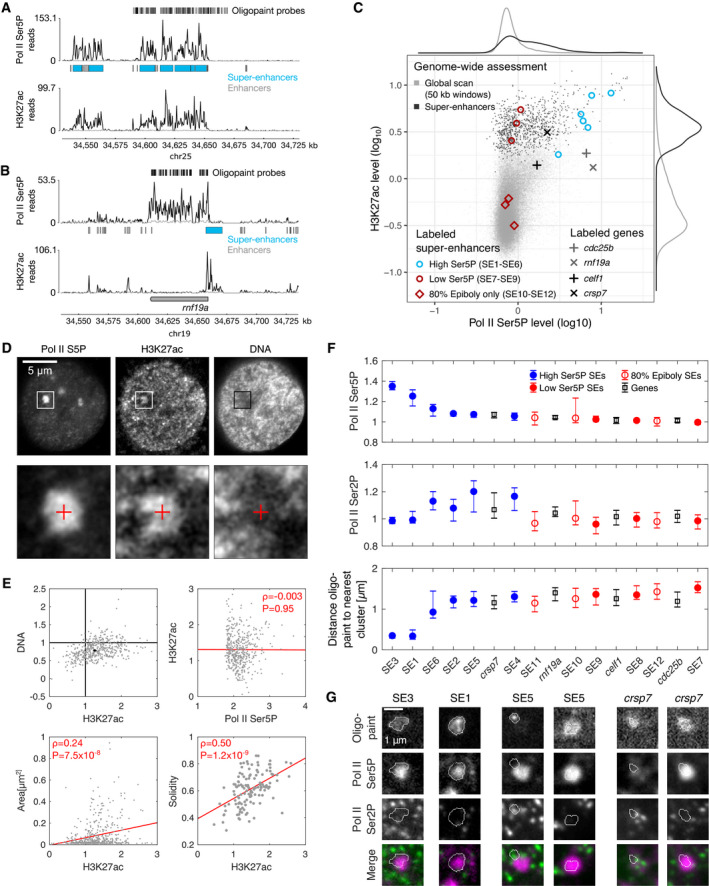
Example view of a genomic region containing a super‐enhancer (SE3), for an overview of all genomic regions labeled by oligopaint probe sets see Appendix Fig Example view of a genomic region containing a gene with high Pol II Ser5P levels at the promoter ( Overview of Pol II Ser5P and H3K27ac ChIP‐seq levels for 50‐kb windows covering the entire genome, windows covering regions containing super‐enhancers, and symbols indicating regions covered by specific oligopaint probe sets. Top row—representative optical section obtained by three‐color STED microscopy from a fixed zebrafish embryo, showing Pol II Ser5P and H3K27ac (immunofluorescence) and DNA (JF646‐Hoechst). Bottom row—Detail views as marked in the top row. The details views are 2.4 μm across. Mean fluorescence intensities (normalized against median intensity of a given nucleus) within Pol II Ser5P clusters. Overall levels of H3K27ac and DNA inside clusters were determined (values for individual clusters in gray, median with 95% bootstrap confidence interval in black) as well as correlations between H3K27ac intensity and Pol II Ser5P intensity, cluster area, and cluster solidity (Pearson correlation coefficient, red line is a linear fit to guide the eye). Assessment of Pol II Ser5P and Pol II Ser2P immunofluorescence signal intensities at the location of super‐enhancer probe sets. Genomic target regions are sorted left‐to‐right by descending Pol II Ser5P signal. Intensities are normalized by the whole nucleus median level, shown is the median with 95% bootstrap confidence intervals. Representative images of indicated oligopaint probe sets and immunofluorescence signal, two examples are shown for SE5 and