
Fig. 7
- ID
- ZDB-IMAGE-211006-7
- Publication
- Leach et al., 2021 - The immune response is a critical regulator of zebrafish retinal pigment epithelium regeneration
- All Figures
- Figures for Leach et al., 2021
|
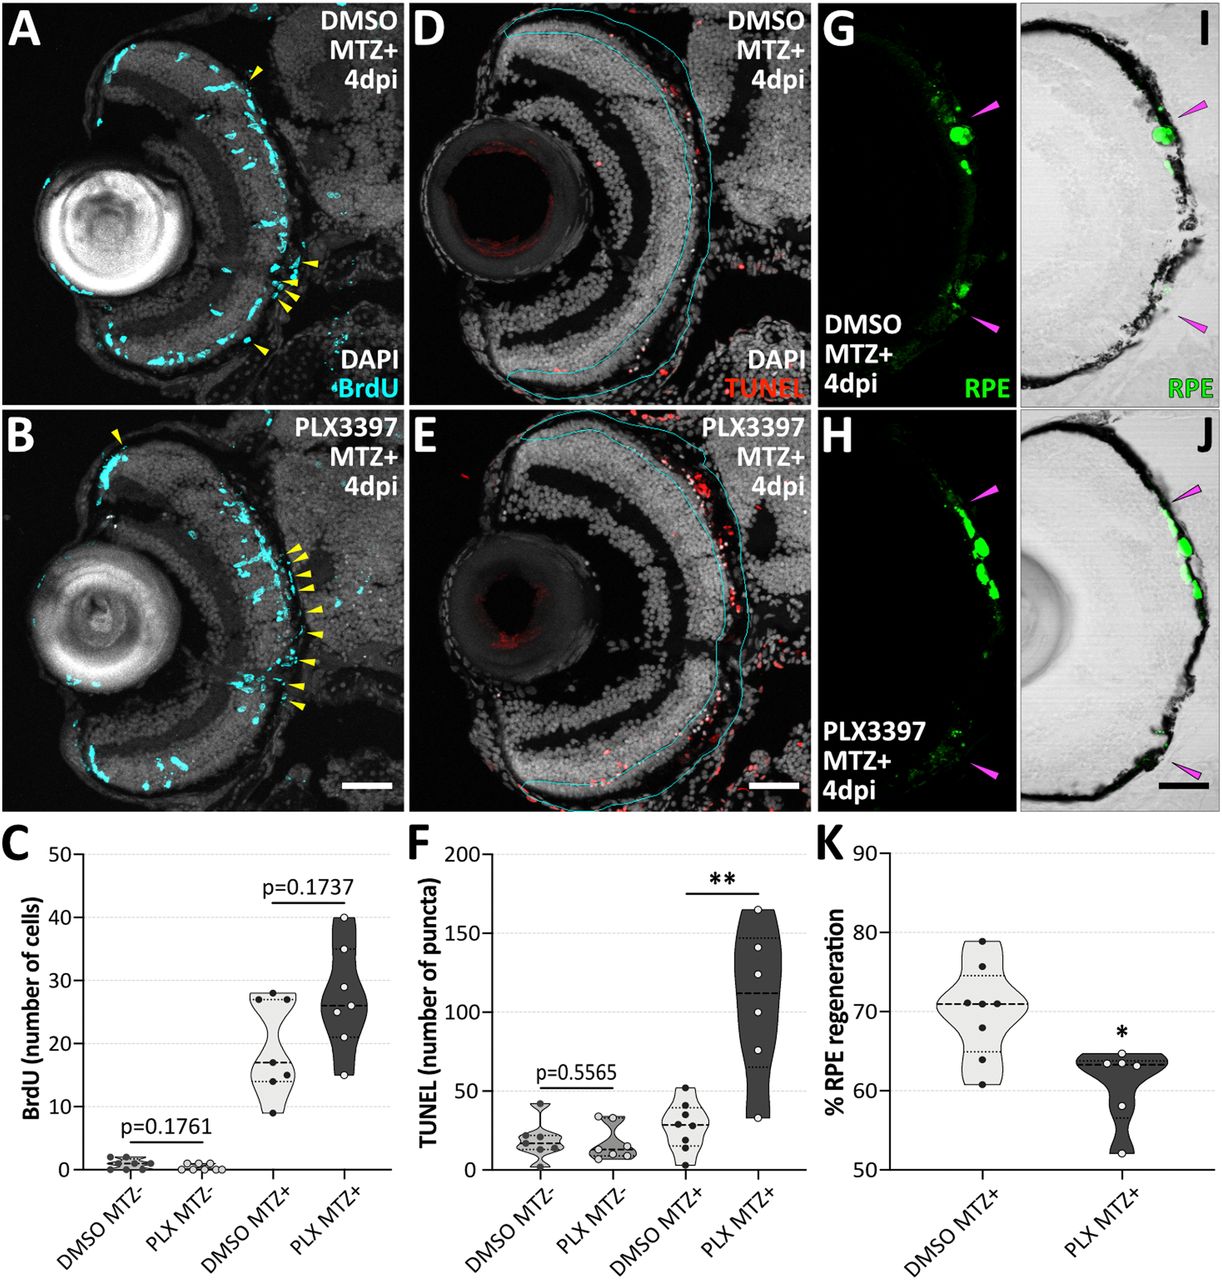
Fig. 7 Treatment with the CSF-1R inhibitor, PLX3397, impairs RPE regeneration. Confocal micrographs of transverse sections showing BrdU (A and B; cyan) and TUNEL (D and E; red) staining and endogenous eGFP (G–J; green) from 4 dpi MTZ+ DMSO- and PLX3397-treated larvae. White (DAPI) labels nuclei. Violin plots showing quantification of BrdU (C) and TUNEL (F) in 9 dpf MTZ− and 4 dpi MTZ+ larval treatment groups. (C) Although not significant, the number of BrdU+ cells in the RPE (A and B; yellow arrowheads) trends upward in 4 dpi MTZ+ PLX3397-treated larvae when compared with 4 dpi MTZ+ DMSO controls. (F) A significant increase was observed in the number of TUNEL+ puncta between the outer plexiform layer and basal RPE (D and E; cyan line) of 4 dpi MTZ+ PLX3397-treated larvae when compared with 4 dpi MTZ+ DMSO controls. In G and H, magenta arrowheads delineate where continuous peripheral-to-central eGFP expression ends, and brightfield confocal micrographs show pigmentation relative to eGFP expansion (I and J; magenta arrowheads). (K) Violin plots showing a significant decrease in RPE regeneration in 4 dpi MTZ+ PLX3397-treated larvae. (Scale bars, 40 μm.) In all violin plots, dashed black lines represent the median, and dotted black lines represent quartiles. SI Appendix, Table S12 contains statistical information. Dorsal is up; *P value ≤ 0.05; and **P value ≤ 0.01.