
Image
|
Figure Caption
Figure 7
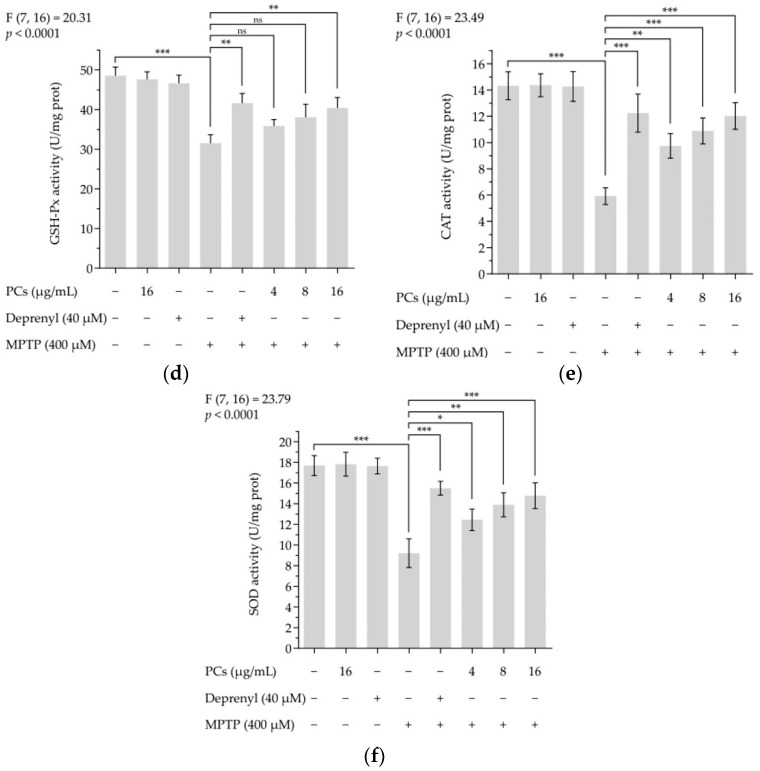
Figure 7. Effects of PCs on oxidative stress of zebrafish larvae treated with MPTP. (a) ROS levels were measured by fluorescent microscopy and imaging analysis; (b) ROS levels were measured via image J software; (c) MDA levels; (d) GSH-Px activity; (e) CAT activity; (f) SOD activity. F and p values of the one-way analysis of variance are presented above each chart. The results of Tukey’s post hoc test are presented for selected comparisons: ns, p > 0.05; *, p < 0.05; **, p < 0.01; ***, p < 0.001; the error bars are SD.
Acknowledgments
This image is the copyrighted work of the attributed author or publisher, and
ZFIN has permission only to display this image to its users.
Additional permissions should be obtained from the applicable author or publisher of the image.
Full text @ Molecules