
Figure 5
- ID
- ZDB-IMAGE-210930-15
- Publication
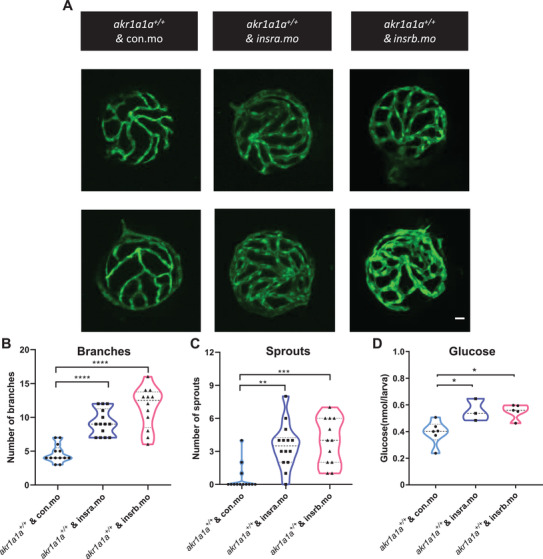
- Qi et al., 2021 - Reduced Acrolein Detoxification in akr1a1a Zebrafish Mutants Causes Impaired Insulin Receptor Signaling and Microvascular Alterations
- All Figures
- Figures for Qi et al., 2021
|
Figure 5