
Fig. 9
- ID
- ZDB-IMAGE-210925-31
- Publication
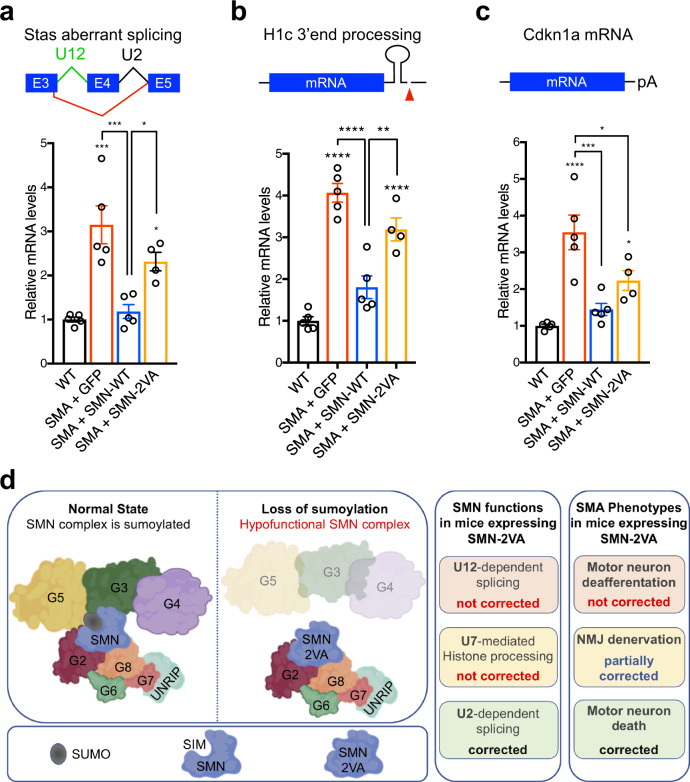
- Riboldi et al., 2021 - Sumoylation regulates the assembly and activity of the SMN complex
- All Figures
- Figures for Riboldi et al., 2021
|
Fig. 9