
Image
|
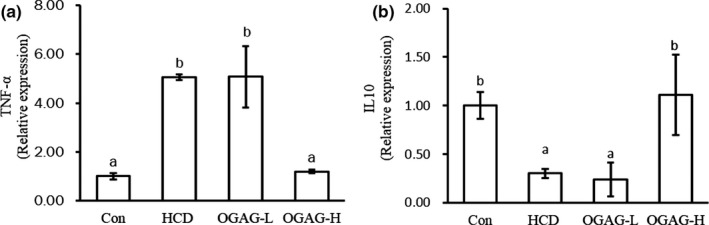
Figure Caption
FIGURE 6
Effect of OGAG treatment on the expression levels of inflammatory cytokines in the hepatic tissue of HC diet‐fed zebrafish using RT‐qPCR. (a) Relative expression levels of TNF‐α and (b) relative expression levels of IL‐10. Data are expressed as the mean ±
Acknowledgments
This image is the copyrighted work of the attributed author or publisher, and
ZFIN has permission only to display this image to its users.
Additional permissions should be obtained from the applicable author or publisher of the image.
Full text @ Food Sci Nutr