
Image
|
Figure Caption
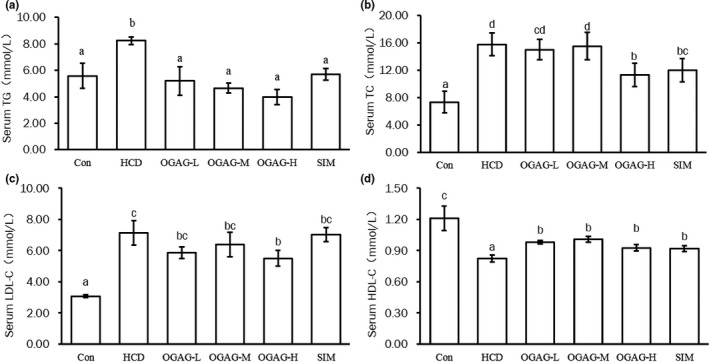
FIGURE 2
Effects of OGAG supplementation on serum lipid levels in zebrafish fed with high‐fat diets for 4 weeks. (a) Serum triglyceride concentration, (b) total cholesterol serum concentration, (c) low‐density lipoprotein cholesterol serum concentration, and (d) high‐density lipoprotein cholesterol serum concentration. Data are expressed as the mean ±
Acknowledgments
This image is the copyrighted work of the attributed author or publisher, and
ZFIN has permission only to display this image to its users.
Additional permissions should be obtained from the applicable author or publisher of the image.
Full text @ Food Sci Nutr