
Image
|
Figure Caption
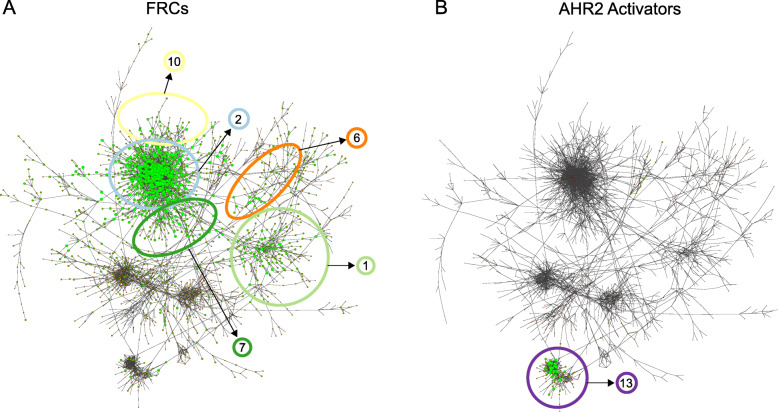
Fig. 3
Network response to FRCs and AHR2 Activators. A Nodes are colored and sized by the number of FRCs they respond to (defined as an FDR p-value < 0.05 when comparing chemical to DMSO control, no fold-change cutoff). Larger green nodes respond to a more chemicals, smaller brown nodes respond to fewer chemicals. General location of modules highly associated with FRCs (Modules 1, 2, 6, 7, and 10) are indicated. B Same as (A) but showing response to AHR2 Activators. Location of Module 13, highly associated with the AHR2 Activators, is indicated
Acknowledgments
This image is the copyrighted work of the attributed author or publisher, and
ZFIN has permission only to display this image to its users.
Additional permissions should be obtained from the applicable author or publisher of the image.
Full text @ BMC Genomics