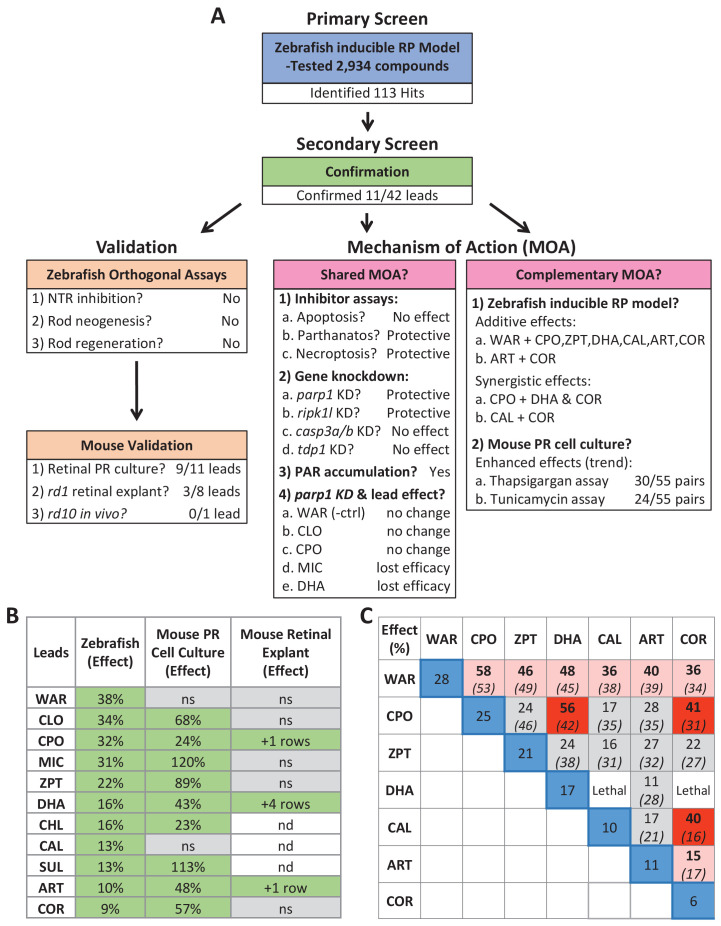
(A) Flow chart of cross-species phenotypic drug discovery process showing results of the primary drug screen, secondary confirmation, orthogonal assays, mouse model tests, shared MOA and complementary MOA assays (i.e. paired drug tests). (B) Summary of survival effects of lead drug candidates across model systems. (C) Summary of survival effects of paired lead drug tests in the zebrafish-inducible RP model showing effects of single drug controls (blue boxes) and paired drug tests that resulted in no additive effects (gray boxes), additive effects (orange boxes) and synergistic effects (red boxes); mathematically summed effect of each pair of lead compounds (italics) are shown for comparison. Abbreviations: as in prior figures.
Acknowledgments
This image is the copyrighted work of the attributed author or publisher, and
ZFIN has permission only to display this image to its users.
Additional permissions should be obtained from the applicable author or publisher of the image.
Full text @ Elife
Your Input Welcome
Thank you for submitting comments. Your input has been emailed to ZFIN curators who may contact you if
additional information is required.
Oops. Something went wrong. Please try again later.