IMAGE

FIGURE 1

ID
ZDB-IMAGE-210911-4
Source
Figures for Gurer et al., 2021
Image
Figure Caption

FIGURE 1

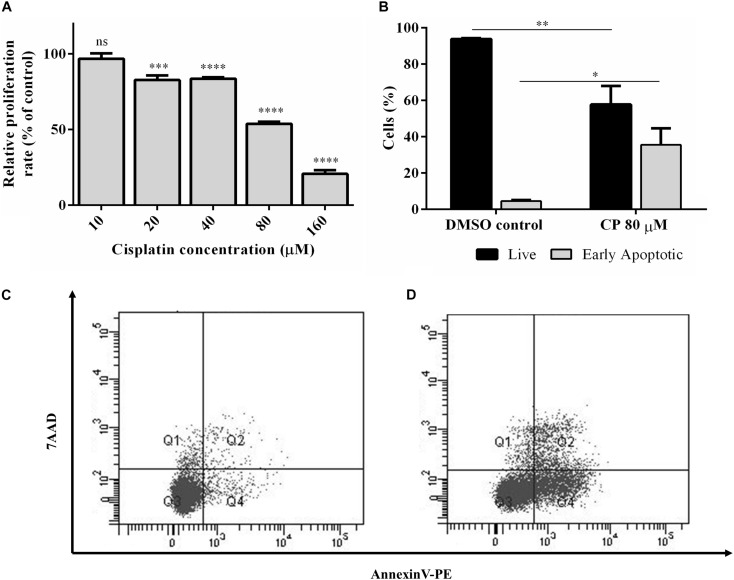
Cisplatin-induced apoptosis and proliferation in HeLa cells. (A) Proliferation kinetics of HeLa cells. HeLa cells were treated with a range of cisplatin concentrations for 16 h and the proliferation rate was measured by WST-1 assay. (B) Percentage of live and early apoptotic population of HeLa cells. Hela cells were treated with 80 μM cisplatin (CP) for 16 h and the rate of apoptotic cells were determined by Annexin-V and 7AAD staining. The stained cells were analyzed by flow cytometry. DMSO (0.1%) was used as negative control. (C,D) The population distributions of DMSO control and CP-treated groups as flow cytometry dot blot graphs, respectively. ns, non-significant, p > 0.05, p ≤ 0.05, ∗∗p ≤ 0.01, ∗∗∗p ≤ 0.001, and ****p ≤ 0.0001.

Acknowledgments
This image is the copyrighted work of the attributed author or publisher, and ZFIN has permission only to display this image to its users. Additional permissions should be obtained from the applicable author or publisher of the image. Full text @ Front Cell Dev Biol