IMAGE

FIGURE 8

ID
ZDB-IMAGE-210911-11
Source
Figures for Gurer et al., 2021
Image
Figure Caption

FIGURE 8

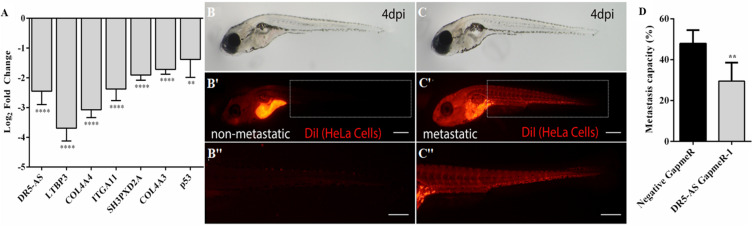
Analysis of metastasis rate in zebrafish xenograft assay. (A) qPCR analysis of metastasis-related genes in HeLa cells transfected with DR5-AS GapmeR-1. DR5-AS was knocked down in HeLa cells by transfecting the cells with DR5-AS GapmeR-1 for 72 h. qPCR was carried out with total RNAs isolated from cells transfected with negative GapmeR and DR5-AS GapmeR-1. To examine the metastasis rate in the zebrafish xenograft assay (B–C”), control cells and DR5-AS GapmeR treated cells were injected to the yolk of 2 dpf zebrafish. (B–B”) Xenografts with non-metastatic tumors display local tumors at the injection site (B’). No tumor cells are detectable in the body (B”). In metastatic xenografts (C–C”), tumor cells are detected in the injection site (C’) and rest of the body (C” a closeup view of cells in the tail region). (D) Percentage of metastatic larvae is 47.9% in control group whereas it is 29.5% in DR5-AS GapmeR group. The graph is plotted based on average of 3 replicates of each cell type (n = 18–20 per set), and 2 independent experiments. Dashed boxes in (B’,C’) indicate the regions imaged in (B”,C”), respectively. Scale bars represent 500 μm. Images were recorded with Olympus SZX16 stereomicroscope. **p ≤ 0.01, ****p ≤ 0.0001.

Acknowledgments
This image is the copyrighted work of the attributed author or publisher, and ZFIN has permission only to display this image to its users. Additional permissions should be obtained from the applicable author or publisher of the image. Full text @ Front Cell Dev Biol