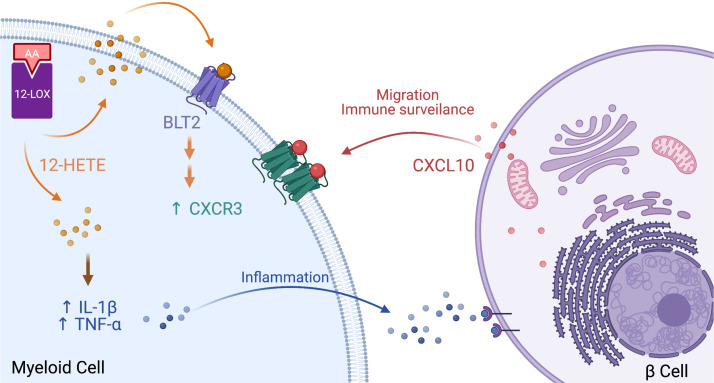
Figure 7 CXCR3 is reduced in the absence of 12-LOX. (A) Chemokine receptor mRNA expression in macrophages from WT and Alox15–/– mice (n = 3–4 mice per genotype; *P < 0.05 by unpaired 2-tailed t test). (B) Representative contour plots showing gating of F4/80+ CXCR3+ cells are shown on the left and F4/80+ CXCR3+ cells as a percentage of total peritoneal cells from WT and Alox15–/– mice are shown on the right (n = 3 mice per genotype; *P < 0.05 by unpaired 2-tailed t test). (C) cxcr3.2 mRNA expression from whole lysates of control-treated and alox12 MO-treated zebrafish (n = 4 independent experiments from pooled zebrafish larvae; *P < 0.05 by unpaired 2-tailed t test). (D) Representative images of injured Tg(mpeg:eGFP) zebrafish tailfins stained with GFP (macrophages, green) and TO-PRO3 (nuclei, red) are shown on the left; and corresponding quantitation of relative number of macrophages at the tail injury site in the control, alox12 MO–injected fish, fish injected with a vector for macrophage-specific overexpression of cxcr3.2, and fish coinjected with alox12 MO and vector for macrophage-specific overexpression of cxcr3.2 is shown on the right (n = 20–30 fish per condition; *P < 0.05 by 1-way ANOVA with post hoc Tukey’s test). (E) Representative images of injured Tg(mpeg:eGFP) zebrafish tailfins stained with GFP (macrophages, green) and TO-PRO3 (nuclei, red) are shown on the left, and corresponding quantitation of relative number of macrophages at the tail injury site in the vehicle control and BLT2 inhibitor LY255283-treated fish is shown on the right (n = 20–25 fish per condition; *P < 0.05 by 1-way ANOVA with post hoc Tukey’s test). Scale bars in D and E indicate 100 μm. (F) Cxcr3 mRNA expression in mouse peritoneal cells treated with 10 μM LY255283 for 24 hours (cells from n = 5 mice per condition; *P < 0.05 by unpaired 2-tailed t test). (G) F4/80+CXCR3+ cells as a percentage of total peritoneal cells by flow cytometry after treatment with 10 μM LY255283 for 24 hours (cells from n = 5 mice per condition; *P < 0.05 by unpaired 2-tailed t test). Data are presented as mean ± SEM. 12-LOX, 12-lipoxygenase; MO, morpholino; GFP, green fluorescence protein; Tg(mpeg:eGFP), transgenic fish containing eGFP-labeled macrophages.
Image
Figure Caption
Acknowledgments
This image is the copyrighted work of the attributed author or publisher, and
ZFIN has permission only to display this image to its users.
Additional permissions should be obtained from the applicable author or publisher of the image.
Full text @ JCI Insight

