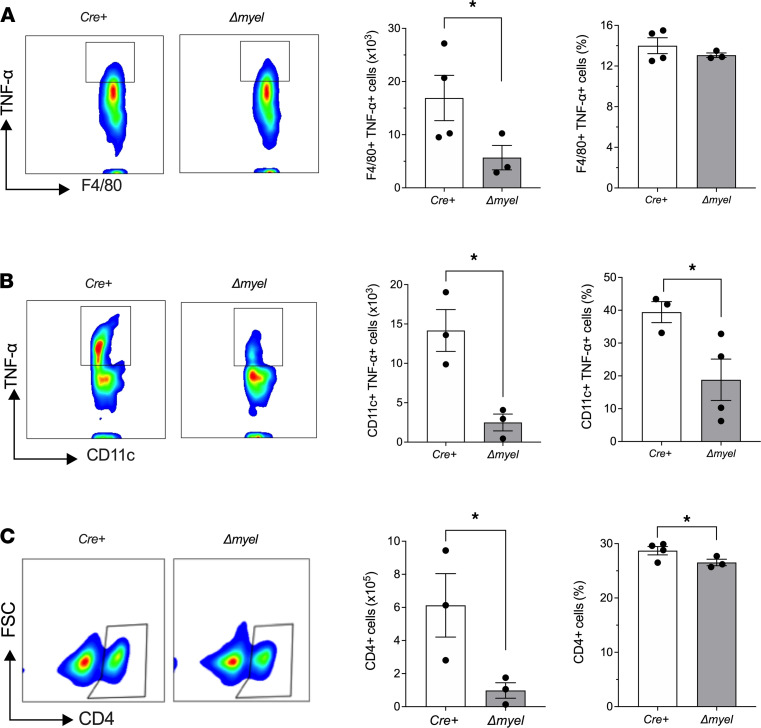
Figure 4 Reduced proinflammatory myeloid cell populations and CD4 T cells in pancreatic lymph nodes of NOD:Alox15Δmyel mice. Pancreatic lymph nodes were isolated from NOD:Lyz2-Cre (Cre+) control mice and NOD:Alox15Δmyel (Δmyel) mice at 8 weeks of age and subjected to flow cytometry analysis. (A) Representative contour plot showing gating of F4/80+ TNF-α+ cells (left), total number of F4/80+ TNF-α+ cells (middle), and F4/80+ TNF-α+ cells as a percentage of total cells (right; n = 3–4 mice per genotype; *P < 0.05 by unpaired 2-tailed t test). (B) Representative contour plot showing gating of CD11c+ TNF-α+ cells (left), total number of CD11c+ TNF-α+ cells (middle), and CD11c+ TNF-α+ cells as a percentage of total cells (right; n = 3–4 mice per genotype; *P < 0.05 by unpaired 2-tailed t test). (C) Representative contour plot showing gating of CD4+ cells (left), total number of CD4+ cells (middle), and CD4+ cells as a percentage of total cells (right; n = 3–4 mice per genotype; *P < 0.05 by unpaired 2-tailed t test). All data are presented as mean ± SEM.
Image
Figure Caption
Acknowledgments
This image is the copyrighted work of the attributed author or publisher, and
ZFIN has permission only to display this image to its users.
Additional permissions should be obtained from the applicable author or publisher of the image.
Full text @ JCI Insight

