
Figure 1
- ID
- ZDB-IMAGE-210909-18
- Publication
- Kulkarni et al., 2021 - 12-Lipoxygenase governs the innate immune pathogenesis of islet inflammation and autoimmune diabetes
- All Figures
- Figures for Kulkarni et al., 2021
|
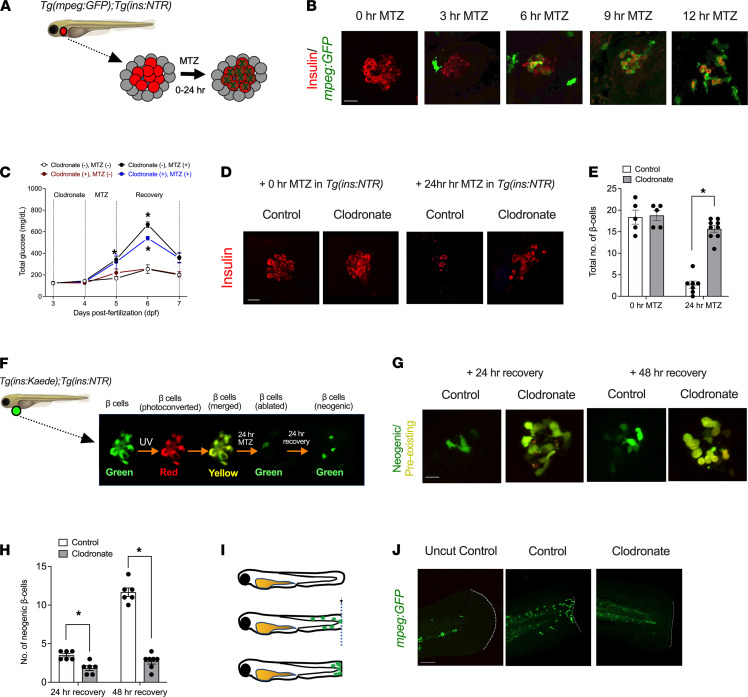
Figure 1 Macrophages promote β cell loss and hyperglycemia after injury in zebrafish. (A) Schematic representation of the β cell injury assay in transgenic Tg(mpeg:eGFP);Tg(ins:NTR) zebrafish at 3 dpf, wherein islet β cells (red) are selectively destroyed upon incubation with MTZ, with the concomitant/subsequent entry of macrophages (green). (B) Representative images of islets from zebrafish treated for the times indicated with MTZ, then stained for insulin (β cells, red) and GFP (macrophages, green). Scale bar: 10 μm. (C) Free glucose measurements of whole zebrafish lysates, treated as indicated in the panel. n = 3–5 lysates per condition (20 fish per lysate), and *P < 0.05 (by 1-way ANOVA with post hoc Tukey’s test) for the corresponding values compared with untreated controls (no clodronate, no MTZ). (D) Representative images of islets from zebrafish stained for insulin (β cells, red) under the conditions indicated. Scale bar: 10 μm. (E) Quantitation of β cell number from the experiment represented in D (*P < 0.05 by unpaired 2-tailed t test). (F) Schematic representation of the β cell regeneration assay, where photoconversion of Kaede protein results in red+green (= yellow) preexisting β cells and newly formed (neogenic) β cells enter as green cells. (G) Representative images of islets from zebrafish exhibiting preexisting (yellow) and neogenic (green) β cells at 24 hours and 48 hours of recovery after MTZ treatment under the conditions (control or clodronate) indicated. Scale bar: 10 μm. (H) Quantitation of neogenic β cell number from the experiment represented in G (n = 6–7 fish/condition; *P < 0.05 by unpaired 2-tailed t test). (I) Schematic representation of the zebrafish tailfin injury assay, where tailfins of Tg(mpeg:GFP) fish at 3 dpf are mechanically cut with a blade, and the migration of macrophages (green) are observed at the site of injury. (J) Representative tailfin images of uninjured and injured zebrafish tails stained with GFP (macrophages, green) under the conditions indicated. Dotted line shows the tailfin injury site. Scale bar: 100 μm. In all panels, data are presented as mean ± SEM. GFP, green fluorescent protein; NTR, nitroreductase; Tg(mpeg:eGFP), transgenic fish containing enhanced GFP–labeled macrophages; Tg(ins:NTR), transgenic β cell NTR–expressing zebrafish; MTZ, metronidazole.