
|
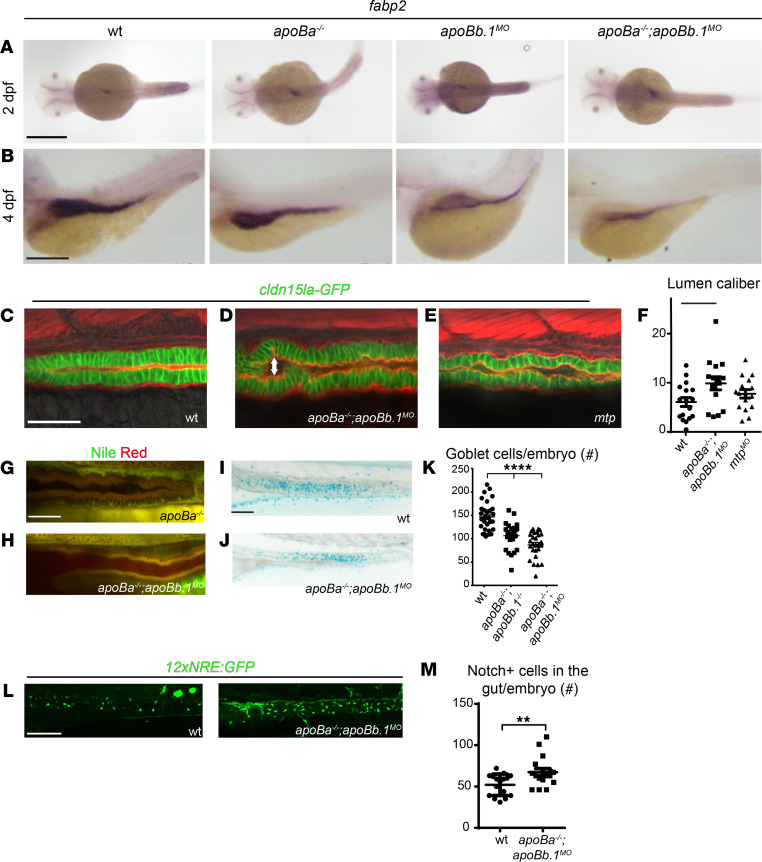
Figure 3 (A and B) WISH showing the spatial expression of fabp2 at 2 (A) and 4 (B) dpf. (C–E) Confocal images at 4 dpf of WT (C), apoBa–/– apoBb.1MO (D), and mtpMO (E) embryos in the TgBAC(cldn15la-GFP)pd1034 reporter background, stained with phalloidin (red). Enlarged lumen caliber (arrow) is detected in apoBa–/– apoBb.1MO and mtpMO embryos, as quantified (F) (n = 2, nWT = 17, napoBa–/– apoBb.1MO = 15, nmtpMO = 16). The data are shown as the mean ± SEM, calculated using ANOVA followed by Tukey’s multiple-comparison test. *P < 0.05. (G and H) Confocal images of the guts of 4 dpf apoBa–/– and apoBa–/– apoBb.1MO embryos stained with Nile red, show no lipid accumulation. (I and J) Bright-field images of 5 dpf embryos stained with Alcian blue showing reduced number of goblet cells in apoBa–/– apoBb.1–/– double mutants (J) as compared with WT embryos (I), as quantified (K) (n = 3, nWT = 30, napoBa–/– apoBb.1–/– = 27, napoBa–/– apoBb.1MO = 27). The data are shown as the mean ± SEM, calculated using ANOVA followed by Tukey’s multiple-comparison test. ****P < 0.0001. (L) Confocal images at 5 dpf of WT and apoBa–/– apoBb.1MO embryos in the Tg(12xNRE:Egfp) reporter background. (M) Quantification of number of cells displaying active Notch signaling in the guts of WT and apoBa–/– apoBb.1MO embryos. The data are shown as the mean ± SEM, calculated using 2-tailed Student’s t test. Scale bar: (A–E, G, and H) 50 μm, (I, J, and L) 100 μm. **P < 0.01. P < 0.05 (considered significant versus control group).