IMAGE

Fig 4

ID
ZDB-IMAGE-210905-13
Source
Figures for Watterston et al., 2021
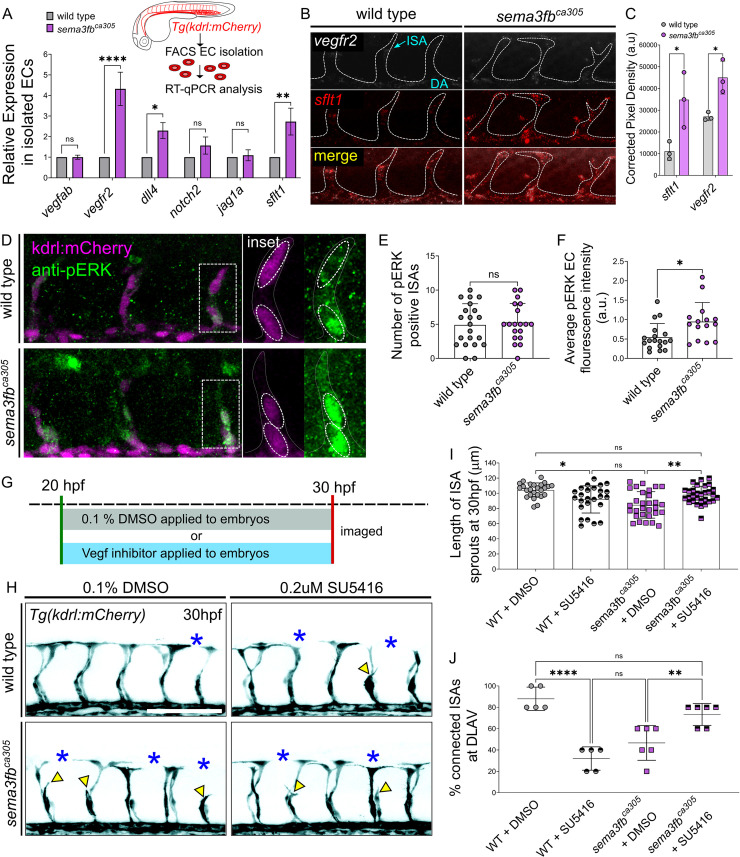
Image
Figure Caption

Fig 4 <italic toggle='yes'>sema3fb</italic> mutants have increased VEGF receptor expression and activity.

A) RT-qPCR analysis of key endothelial markers in wild type and sema3fbca305 FACS isolated Tg(kdrl:mCherry) positive endothelial cells at 26hpf (inset). N = 2, 2-Way ANOVA Tukey’s multiple comparisons test, *p = 0.0184, **p = 0.0021, and ****p<0.0001 (Refer to S3 Table for fold-change details). B) Fluorescent HCR in situ of 30 hpf whole-mount wild type and embryos sema3fbca305 embryos. Representative images show punctate overlapping expression of vegfr2 (white) and sflt1 (red) mRNA transcripts within the DA and ISAs (dashed white outline). C) Quantification of HCR in situ pixel density in ISAs and DA, wild type (WT, n = 3 embryos, 15 ISAs) and sema3fbca305 (n = 3 embryos, 15 ISAs), Unpaired Student’s t-test with Welch’s correction WT vs. sema3fbca305: vegfr2 *p = 0.047 and sflt1 *p = 0.036. D) Whole-mount Immunostaining for phosphoERK (pERK) in WT and sema3fbca305 embryos fixed at 30 hpf. Representative images show Tg(kdrl:mCherry) positive ISAs (purple) and pERK positive ECs (green). Inset: pERK positive ISAs are traced using kdrl:mCherry expression (dashed white line) and dashed oval outlines highlight individual ECs with pERK staining within each ISA. E) Number of pERK positive ISAs at 30hpf. F) Quantification of average pERK fluorescence intensity in embryos at 30 hpf. D-E) N = 3, WT (n = 21 embryos, mean of 5 pERK positive ISAs), and homzygous sema3fbca305 (n = 19 embryos, mean of 5 pERK positive ISAs). 2-Way ANOVA Tukey’s multiple comparisons test, *p = 0.012. G) Schematic of Vegfr2 inhibition time course, embryos are treated at 20 hpf with either 0.1%DMSO or Vegfr2 inhibitors and removed from treatment for live imaging at 30hpf. H) Representative confocal images of trunk vasculature (black) of 30 hpf embryos treated with DMSO control or 0.2 μM SU5416. DLAV gaps (blue asterisks) and truncated ISA (yellow arrowheads) are marked. Scale bar, 100 μm. I) Length of ISA sprouts in treated embryos at 30 hpf: WT + DMSO (n = 25 ISAs, mean of 104±9 μm), WT + 0.2 μM SU5416 (n = 25 ISAs, mean of 92±17 μm), sema3fbca305 + DMSO (n = 30 ISAs, mean of 85±17 μm), and sema3fbca305 + 0.2μm SU5416 (n = 30 ISAs, mean of 98±11 μm) **p = 0.0039 and ****p<0.0001. J) Percentage of ISA sprouts connected at DLAV in treated embryos at 30 hpf. WT + DMSO (n = 25 ISA-DLAV, 5 embryos, mean 88±11%), WT + 0.2μM SU5416 (n = 25 ISA-DLAV, mean 32±11%), sema3fbca305 + DMSO (n = 30 ISA-DLAV, mean 46±16%), and sema3fbca305 +0.2 μm SU5416 (n = 30 ISA-DLAV, mean 73±10%), **p = 0.0084, ***p = 0.0002, and ****p<0.0001. I-J N = 2; WT+DMSO = 5 embryos, WT + 0.2 μM SU5416 = 5 embryos, sema3fbca305 + DMSO = 6 embryos, sema3fbca305 + 0.2 μm SU5416 = 6 embryos,. 2-Way ANOVA Tukey’s multiple comparisons test. Error Bars = ±SD.

Acknowledgments
This image is the copyrighted work of the attributed author or publisher, and ZFIN has permission only to display this image to its users. Additional permissions should be obtained from the applicable author or publisher of the image. Full text @ PLoS Genet.