
Figure 8.
- ID
- ZDB-IMAGE-210904-30
- Publication
- Yan et al., 2021 - Single-cell imaging of T cell immunotherapy responses in vivo
- All Figures
- Figures for Yan et al., 2021
|
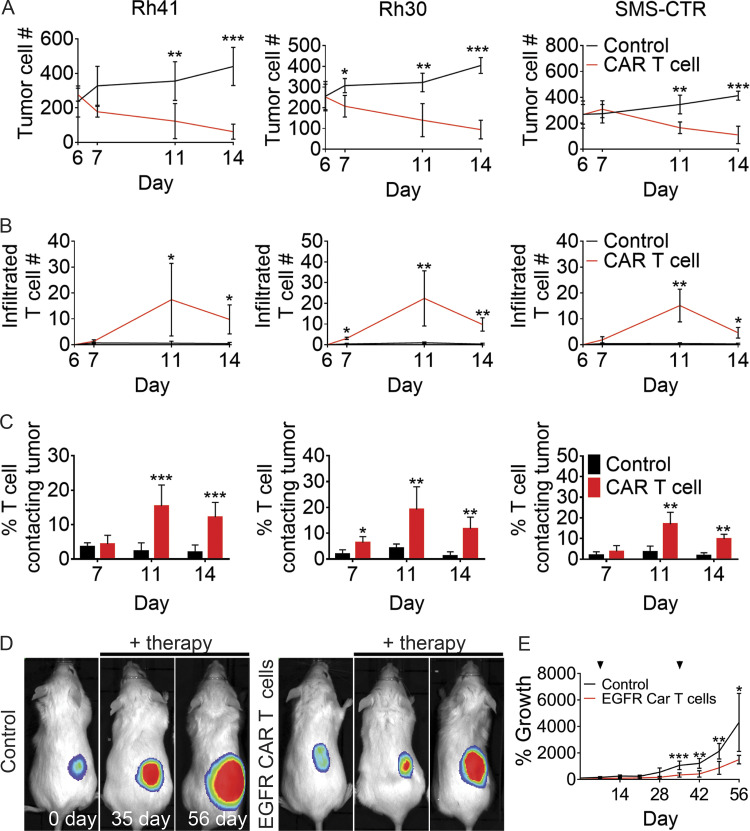
Figure 8.
EGFR CAR T cells kill human RMS cells in both rag2Δ/Δ, il2rga −/− zebrafish and NSG mouse xenograft models. (A) Quantification of total tumor cell number within each experimental animal (n = 5 fish/experimental arm). (B) Quantification of CAR T cells infiltrated into the tumor mass over time (n = 5 animals/experimental arm). (C) Percentage of T cells that directly contacted RMS tumor cells. (D) Representative luciferase images of RD xenografted tumors in NSG mice (n = 6 mice/experimental arm). (E) Quantification of relative growth of xenografted RD tumors in NSG mice receiving either control CD8+ T cells or EGFR CAR T cells. Arrowheads denote time of CAR T cell administration. *, P < 0.05; **, P < 0.01; ***, P < 0.001, Student’s t test. Error bars denote ±SD (A–C and E). Rh41 and Rh30, fusion-positive RMS; SMS-CTR, fusion-negative RMS.