
Image
|
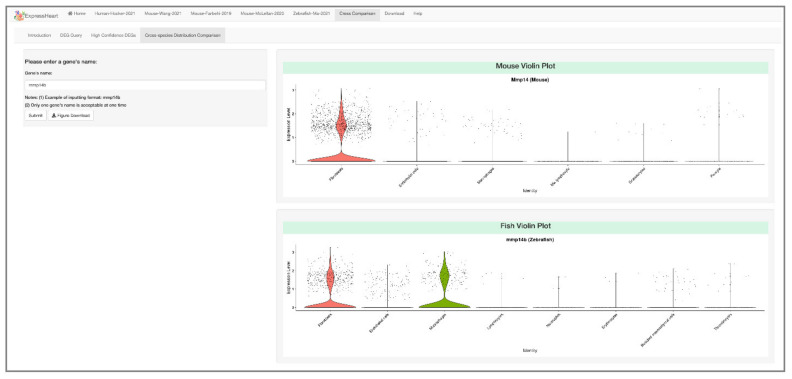
Figure Caption
Figure 7
Cross-species comparison between mouse and zebrafish datasets. Users can input the homolog gene name on the left panel, and the corresponding violin plots for the homolog genes (mmp14b in zebrafish, and Mmp14 in mouse) are shown on the right. Here, mmp14b is expressed in 28.0% and 27.8% of fibroblasts and macrophages of zebrafish, while its homolog gene Mmp14 is expressed in a similar proportion of fibroblasts (28.5%), but in a much lower proportion of macrophages (0.9%) of mouse.
Acknowledgments
This image is the copyrighted work of the attributed author or publisher, and
ZFIN has permission only to display this image to its users.
Additional permissions should be obtained from the applicable author or publisher of the image.
Full text @ Int. J. Mol. Sci.