
IMAGE
Figure 3
- ID
- ZDB-IMAGE-210902-292
- Publication
- Pinto et al., 2021 - Zebrafish Motile Cilia as a Model for Primary Ciliary Dyskinesia
- All Figures
- Figures for Pinto et al., 2021
Image
|
Figure Caption
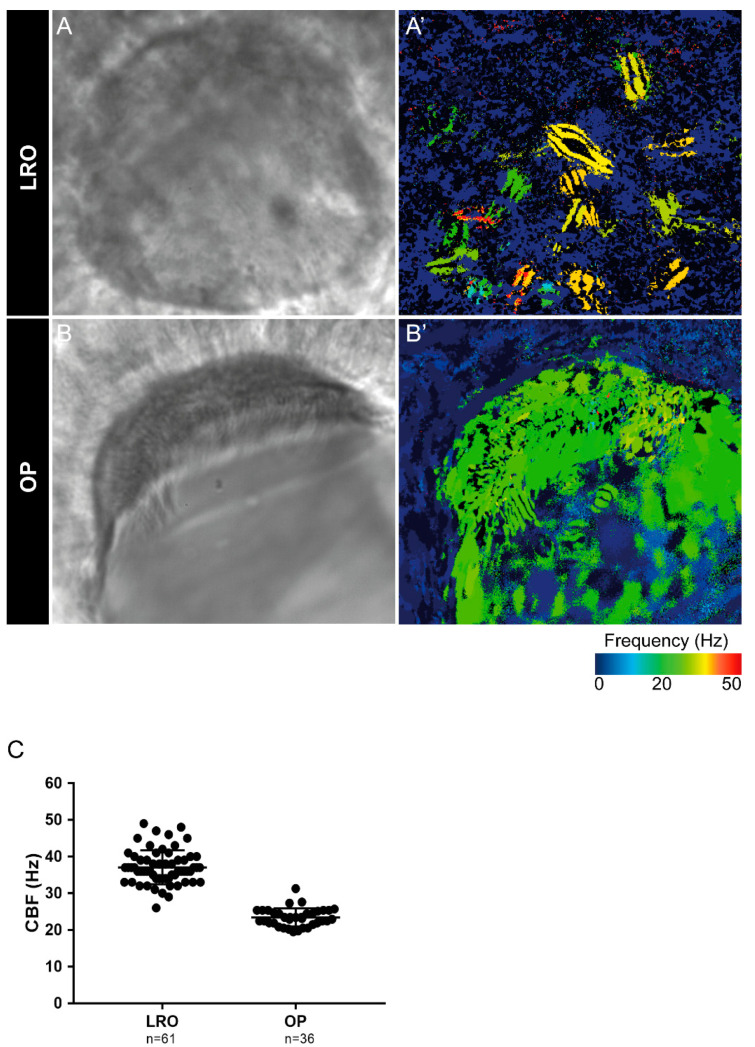
Figure 3
Cilia beat frequency (CBF) evaluation for zebrafish cilia. (A,A’) Full LRO heatmap showing several monocilia at one plane beating at different frequencies (20–50 Hz). (B,B’) OP heatmap showing multiciliated cells with cilia beating at more homogeneous frequencies (around 20 Hz). CBF was measured using the software CiliarMove [41] (C) Quantification of CBF from n = 61 LROs and n = 36 OPs from embryos at 10 ss and 4 dpf larvae, respectively.
Acknowledgments
This image is the copyrighted work of the attributed author or publisher, and
ZFIN has permission only to display this image to its users.
Additional permissions should be obtained from the applicable author or publisher of the image.
Full text @ Int. J. Mol. Sci.