
IMAGE
Figure 2
- ID
- ZDB-IMAGE-210902-291
- Publication
- Pinto et al., 2021 - Zebrafish Motile Cilia as a Model for Primary Ciliary Dyskinesia
- All Figures
- Figures for Pinto et al., 2021
Image
|
Figure Caption
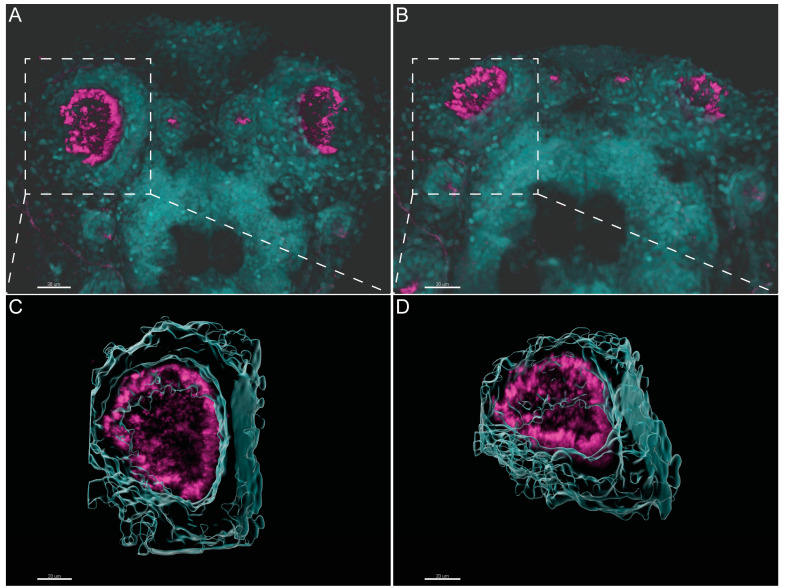
Figure 2
Three-dimensional imaging analysis helps to orient and localize the OP of zebrafish for TEM studies. (A,B). Immunofluorescent labelling with anti-acetylated α-tubulin shows the distribution of multiciliated cells in the OP of 4 dpf larvae. Software Imaris (Bitplane) v.9.5.0 allowed 3D blend reconstructions of 2 different OPs from 2 different larvae. (C,D) 3D surface reconstructions from the respective OPs revealing the concave morphology of the organ when rotated. Anti-Acetylated α-tubulin immunofluorescence in magenta and DAPI in cyan. Scale bar 20 μm.
Acknowledgments
This image is the copyrighted work of the attributed author or publisher, and
ZFIN has permission only to display this image to its users.
Additional permissions should be obtained from the applicable author or publisher of the image.
Full text @ Int. J. Mol. Sci.