
IMAGE
Figure 5
- ID
- ZDB-IMAGE-210902-274
- Publication
- Nowik et al., 2021 - The Role of Galanin during Bacterial Infection in Larval Zebrafish
- All Figures
- Figures for Nowik et al., 2021
Image
|
Figure Caption
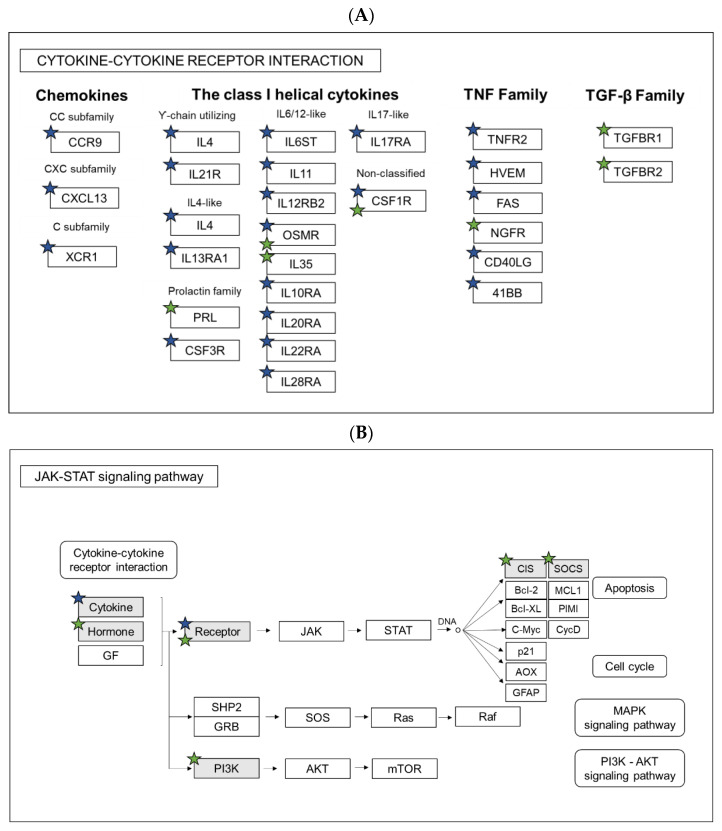
Figure 5
Pathway analysis. Comparison of regulated genes between gal+/+ and gal−/− larvae after M. marinum infection in KEGG Pathways: (A) Cytokine-cytokine receptor interaction and (B) JAK-STAT signaling pathway. Blue stars indicate genes regulated in gal+/+, while green in gal−/−.
Acknowledgments
This image is the copyrighted work of the attributed author or publisher, and
ZFIN has permission only to display this image to its users.
Additional permissions should be obtained from the applicable author or publisher of the image.
Full text @ Cells