
FIGURE 2
- ID
- ZDB-IMAGE-210902-26
- Genes
- Publication
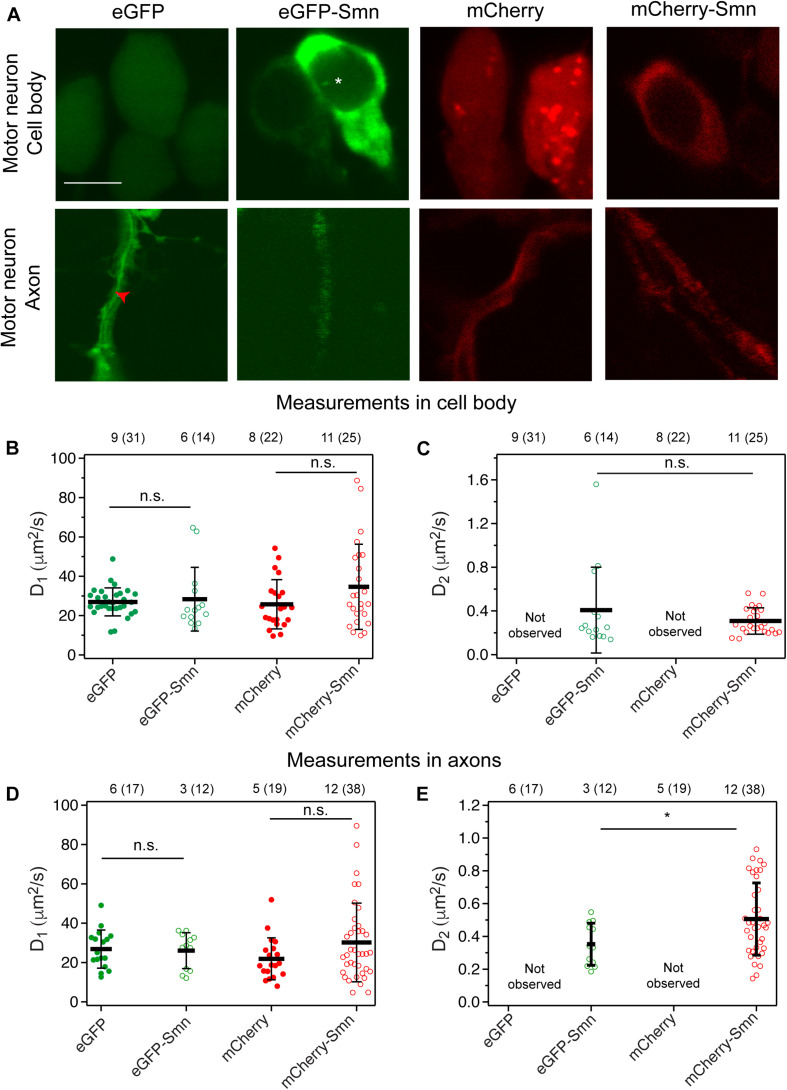
- Koh et al., 2021 - Fluorescence Correlation Spectroscopy Reveals Survival Motor Neuron Oligomerization but No Active Transport in Motor Axons of a Zebrafish Model for Spinal Muscular Atrophy
- All Figures
- Figures for Koh et al., 2021
|
FIGURE 2
Expression and diffusion coefficients of FPs and FP-tagged Smn in zebrafish motor neurons.