
Figure 3
- ID
- ZDB-IMAGE-210902-259
- Publication
- Sun et al., 2021 - Evolution and Functional Characteristics of the Novel elovl8 That Play Pivotal Roles in Fatty Acid Biosynthesis
- All Figures
- Figures for Sun et al., 2021
|
Figure 3
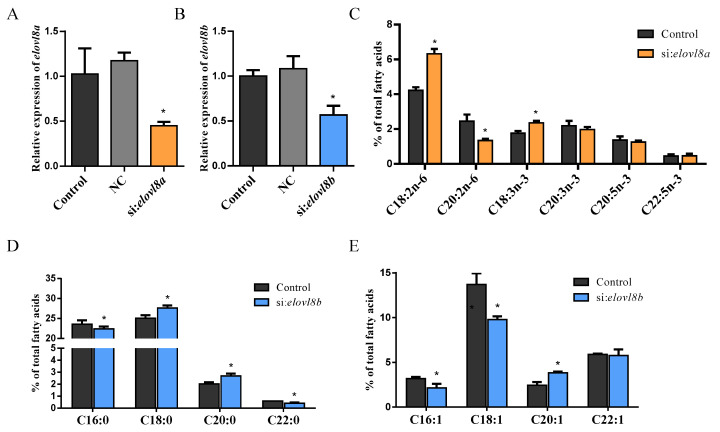
Effects of elovl8a and elovl8b knockdown on liver fatty acid composition. (A) The expression level of elovl8a in si:elovl8a treated ZFL cells. (B) The expression level of elovl8b in si:elovl8b treated ZFL cells. (C) PUFA composition of control and si:elovl8a treated ZFL cells. (D,E) SFA (D) and MUFA (E) composition of control and si:elovl8b treated ZFL cells. The statistical analyses were conducted by t test. Data were expressed as mean ± SD (standard deviation) of three biological replicates. The asterisks labeled above the error bars indicate significant differences (* p < 0.05). NC, negative control; SFAs, saturated fatty acids; MUFAs, monounsaturated fatty acids; PUFAs, polyunsaturated fatty acids; elovl, elongation of very long-chain fatty acid protein.