
|
Figure 7
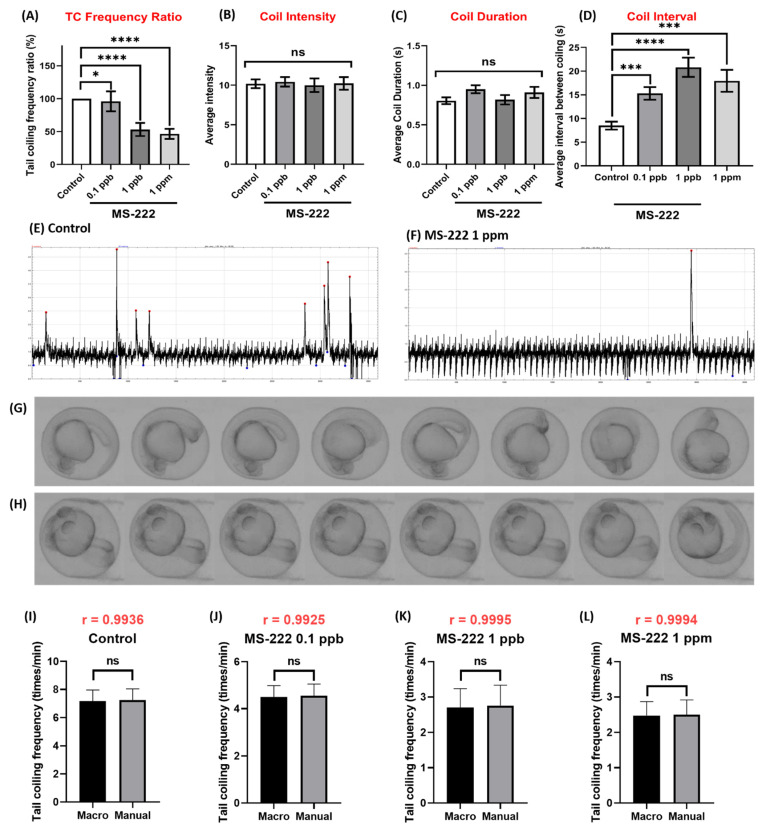
Comparison of tail coiling activity for zebrafish embryos at 24 hpf for control and MS-222 exposure. (A) Quantitative comparison of tail coiling frequency ratio, (B) average intensity, (C) coil duration and (D) coil interval of zebrafish embryos treated with different doses of MS-222. The representative tail coiling peak obtained from either (E) control or (F) 1 ppm MS-222 exposed zebrafish. Time-lapse comparison showing tail coiling movement in zebrafish embryo after receiving either (G) 0 or (H) 1 ppm MS-222. Statistical validation is carried out using Kruskal-Wallis test. Data are presented as Mean ± SEM, n = 40. (I–L) Statistic comparison of data collected by either TCMacro or manual counting for either (I) control, (J) MS-222 0.1 ppb, (K) MS-222 1 ppb or (L) MS-222 10 ppb treated embryos. The statistical difference is double validated using Pearson correlation (black color) and Wilcoxon test (red color). Data are presented as Mean ± SEM, n = 40 (* p < 0.05, *** p < 0.001, **** p < 0.0001, ns p > 0.05).