
Image
|
Figure Caption
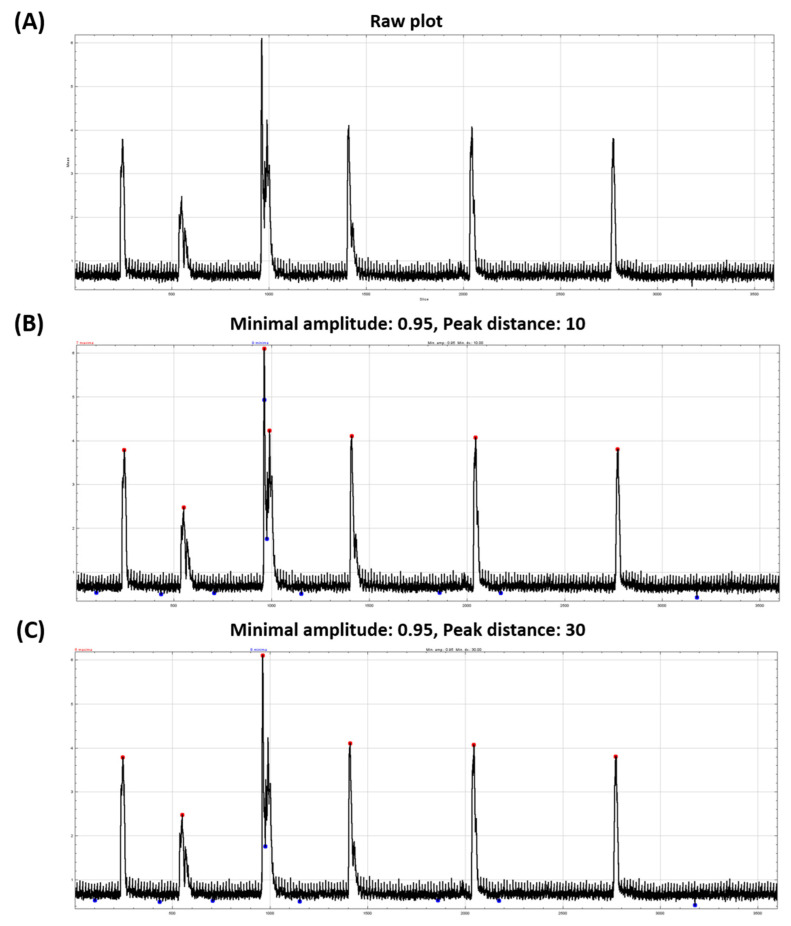
Figure 4
Tail coiling activity plot over time for zebrafish embryo tail coiling activity measurement. The x-axis represents time (frame), while the y-axis represents signal intensity. Raw tail coiling activity plot obtained from Plot Z-axis Profile tool (A) and peaks extracted at 0.95 minimal amplitude and different peak distance of 10 (B) and 30 (C), x-axis = video frames, y-axis = intensity.
Acknowledgments
This image is the copyrighted work of the attributed author or publisher, and
ZFIN has permission only to display this image to its users.
Additional permissions should be obtained from the applicable author or publisher of the image.
Full text @ Biomolecules