
|
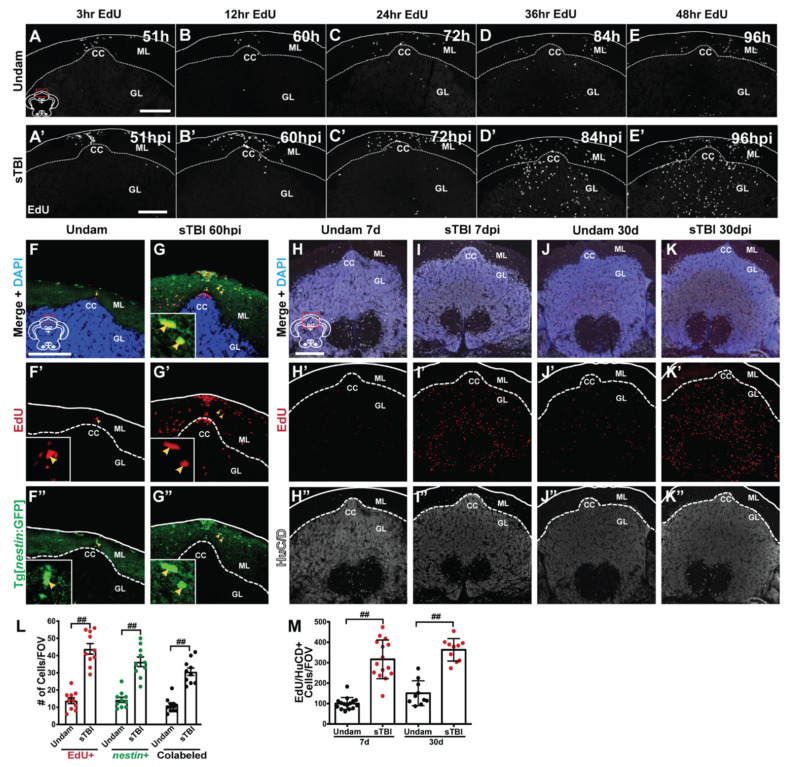
Figure 10
Blunt-force TBI induces cell proliferation, migration, and differentiation in the cerebellum. (A–E’) Coronal cerebellar sections of sTBI fish (A’–E’) that were IP-injected with EdU at 48 hpi and collected 51, 60, 72, 84, and 96 hpi to identify the migration pattern of injury-induced proliferative cells. Control undamaged fish (A–E) were also injected and brains assessed at similar intervals as sTBI fish. Coronal cerebellar sections of undamaged (F) and sTBI (G) Tg[nestin:GFP] fish with high magnification insets (F’–F’’,G’–G”) that were IP-injected with EdU 12 h prior to collection at 60 hpi with colabeling of EdU and Tg[nestin:GFP] (yellow arrowheads). Coronal cerebellar sections of undamaged (H–H’’,J–J’’) and sTBI fish (I–I’’,K–K’’) that were IP-injected with EdU at 48 and 60 hpi to capture early onset and peak proliferative events and collected at either 7 (H–I’’) or 30 dpi (J–K’’) and costained with HuCD. (L) Quantification of the number of EdU-positive, nestin:GFP-positive, or colabeled cells for experiments in representative images (F–G”) (n = 10). (M) Quantification of the number of EdU/HuCD colabeled cells for experiments in representative images (H–K”) (n = 15). Solid lines in (A–K”) denote tissue boundary, while dotted lines denote internal anatomical boundaries. Cerebellar crest, CC, granule cell layer, GL, molecular layer, ML. All scale bars = 100 µm. Mean ± SEM is depicted in L and M. Statistical analyses were performed with either a One-way ANOVA or Two-way ANOVA followed by a Tukey’s post-hoc test. ## p < 0.01.