IMAGE

Figure 8

ID
ZDB-IMAGE-210902-217
Source
Figures for Hentig et al., 2021
Image
Figure Caption

Figure 8

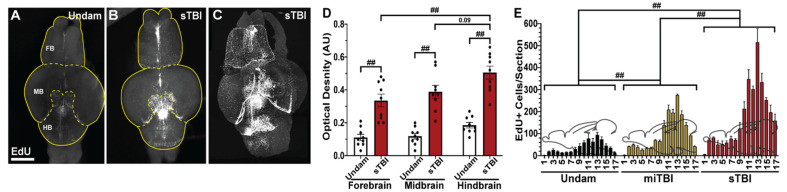
Blunt-force TBI results in increased proliferation in the brain. (A,B) Dorsal view of isolated and chemically-cleared undamaged (A) and sTBI (B) brains labeled with EdU and analyzed by fluorescent microscopy. The position of the forebrain (FB), midbrain (MB), and hindbrain (HB) are delineated. (C) Chemically-cleared sTBI brain imaged by lightsheet microscopy. (D) Quantification of optical density of EdU fluorescence by bulk brain region revealed significant increases in fluorescence in all sTBI regions relative to undamaged brains, with the largest increase seen in the hindbrain near the impact epicenter (n = 9). (E) Quantification of the total number of EdU-positive cells per section across the neuroaxis of undamaged, miTBI, and sTBI fish (n = 4). Significant increases in proliferation were observed in miTBI and sTBI brains relative to undamaged brains from the rostral tip of the olfactory bulb to caudal tip of the cerebellum. Scale bar = 500 µm. Mean ± SEM is depicted in D and E. Statistical analyses were performed with either a One-way ANOVA or Two-way ANOVA followed by a Tukey post-hoc test. ## p < 0.01.

Acknowledgments
This image is the copyrighted work of the attributed author or publisher, and ZFIN has permission only to display this image to its users. Additional permissions should be obtained from the applicable author or publisher of the image. Full text @ Biomedicines