
|
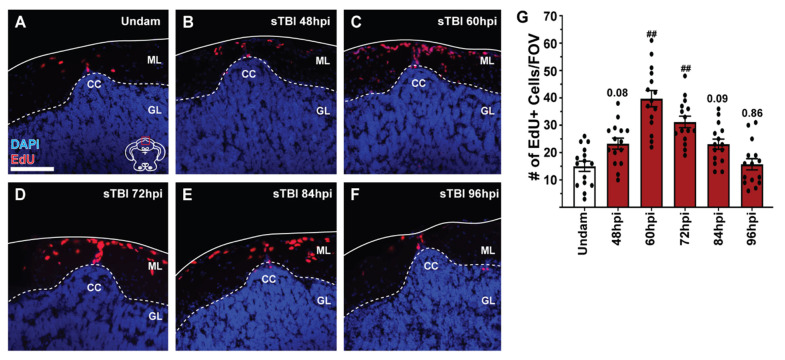
Figure 7
Blunt-force TBI induces cell proliferation at the cerebellar crest. (A–F) Confocal images of coronal cerebellar sections of undamaged and sTBI fish that were IP-injected with EdU 12 h prior to collection. EdU-labelled cells (red) are present radiating from the cerebellar crest in all panels. (G) Quantification of the number of EdU-positive cells at the CC at various timepoints following sTBI (n = 15). Increased EdU labeling, relative to undamaged fish, was observed as early as 48 hpi, with peak proliferation at 60 hpi. Solid lines in (A–F) denote tissue boundary, while dotted lines denote internal anatomical boundaries. Cerebellar crest, CC, granule cell layer, GL, molecular layer, ML. Scale bar = 100 µm for (A–F). Mean ± SEM is depicted in (G). Statistical analysis was performed using a One-way ANOVA followed by a Tukey’s post-hoc test. # p < 0.05, ## p < 0.01.