
Figure 6
- ID
- ZDB-IMAGE-210902-170
- Publication
- Hsieh et al., 2021 - Depletion of Alpha-Melanocyte-Stimulating Hormone Induces Insatiable Appetite and Gains in Energy Reserves and Body Weight in Zebrafish
- All Figures
- Figures for Hsieh et al., 2021
|
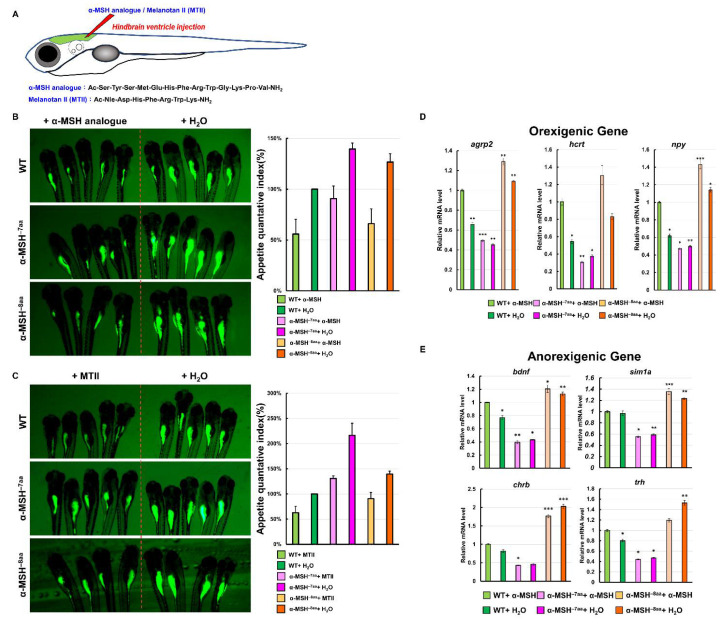
Figure 6
Effects of a synthetic α-MSH analog in rescuing hyperphagic phenotypes in α-MSH mutant larvae. (A) Schematic representation of hindbrain ventricle injection of an α-MSH analog/MTII into α-MSH mutant larvae. (B) α-MSH analog, and (C) MTII. Left: Administration decreased feeding volume in α-MSH mutant larvae at 7 dpf. Right: Bar graph showing the quantified appetite levels measured by morphometric analysis of fluorescent intensities in each experimental group (WT, α-MSH−7aa, and α-MSH−8aa) (n = 50/group). Values are means ± SEM. * p < 0.05, ** p < 0.01, and *** p < 0.001 compared with WT groups. (D,E) RT–qPCR analysis was used to measure the mRNA levels of three selected orexigenic genes, agrp2, npy, and hcrt (D), and four selected anorexigenic genes, bdnf, sim1a, crhb, and trh (E) in the WT and α-MSH mutant larvae at 1.5 h after feeding. We used relative fluorescent change and relative transcriptome expression for quantification three times (n = 50) independently.